Quick Links
Prometheus is an open-source monitoring solution for collecting and aggregating metrics as time series data. Put more simply, each item in a Prometheus store is a metric event accompanied by the timestamp it occurred.
Prometheus was originally developed at Soundcloud but is now a community project backed by the Cloud Native Computing Foundation (CNCF). It's rapidly grown to prominence over the past decade as its combination of querying features and cloud-native architecture have made it the ideal monitoring stack for modern applications.
In this article, we'll explain the role of Prometheus, tour how it stores and exposes data, and highlight where Prometheus' responsibility ends. Part of its popularity is down to the software's interoperability with other platforms which can surface data in more convenient formats.
What Does Prometheus Do?
Prometheus stores events in real-time. These events can be anything relevant to your application, such as memory consumption, network utilization, or individual incoming requests.
The fundamental data unit is a "metric." Each metric is assigned a name it can be referenced by as well and a set of labels. Labels are arbitrary key-value data pairs that can be used to filter the metrics in your database.
Metrics are always based on one of four core instrument types:
- Counter - A value that steadily increments, never decreasing or resetting.
- Gauge - A value that can change in any direction at any time.
- Histogram - A sampling of multiple values that provides a sum of all the stored values, as well as the count of recorded events.
- Summary - A summary functions similarly to a histogram but supports configurable quantiles for aggregate monitoring over sliding time periods.
Prometheus determines the current value of your metrics by using a pull-based data fetching mechanism. It'll periodically poll the data source that backs each metric, then store the result as a new event in the time-series database. The monitored application is responsible for implementing the endpoint used as the data source; such data providers are commonly described as exporters.
The pull-based model simplifies integrating Prometheus into your applications. All you need to do is provide a compatible endpoint that surfaces the current value of the metric to collect. Prometheus handles everything else. Although this can lead to inefficiencies - for example, if Prometheus polls the endpoint again before its data has changed - it means your code doesn't need to handle metric transportation.
More About Exporters
Exporters are responsible for exposing your application's metrics ready for Prometheus to collect. Many users will begin with a simple deployment of the Node Exporter which collects basic system metrics from the Linux host it's installed on.
A wide variety of exporters are available with many provided by Prometheus itself or official community vendors. Whether you're monitoring a popular database engine like MySQL, PostgreSQL, and MongoDB, or you're tracking an HTTP server, logging engine, or messaging bus, there's a good chance an exporter already exists.
You can track your application's own metrics by writing your own exporter. There's really no limits with this approach - you could capture time spent on a landing page, sales volume, user registrations, or anything else that matters to your system.
Exporters are simple HTTP API endpoints so they can be constructed in any programming language. Prometheus provides official client libraries for Go, Java/Scala, Python, and Ruby which make it easier to instrument your code. Community initiatives have provided unofficial libraries for most other popular languages too.
Querying Prometheus Data
Data within Prometheus is queried using PromQL, a built-in query language that lets you select, parse, and format metrics using a variety of operators and functions. As Prometheus uses time-series storage, there's support for time-based range and duration selections that make light work of surfacing data added within a specific time period.
Here's an example that surfaces all the memory_consumption events within the last hour:
memory_consumption[1h]
This example only surfaces the memory consumption events recorded during the last hour.
You can filter by label by adding key-value pairs inside curly braces:
memory_consumption{app="api"}[1h]
Built-in functions provide opportunities for more precise analysis. Here's an example that uses the rate() function to calculate the rate of increase of the memory_consumption metric over the selected time period:
rate(memory_consumption[1h])
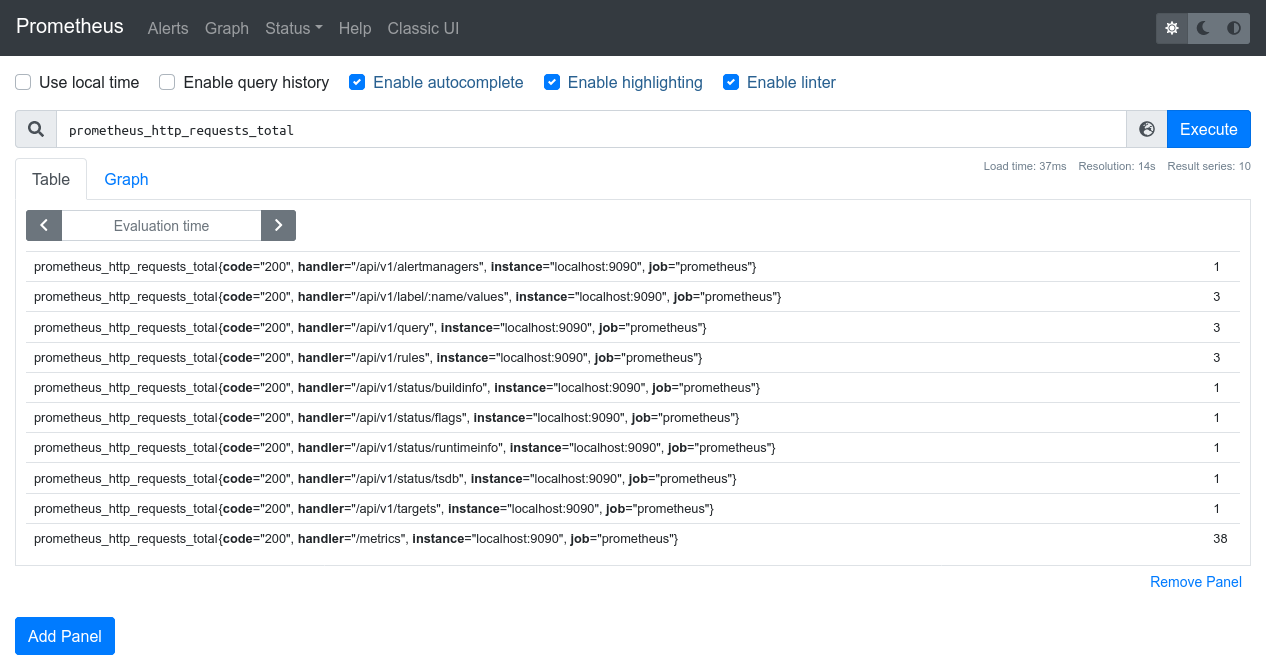
Prometheus data can be accessed via the built-in web UI, usually exposed on port 9090, or the HTTP API. The latter provides a robust way to get data from Prometheus into other tools such as dashboard solutions.
Alerts
Prometheus comes with an Alertmanager component that can send you notifications when metrics change. It supports rule-based policies that determine when an alert should be sent.
You can receive alerts to your email address, arbitrary HTTP webhooks, and popular messaging platforms such as Slack. Alertmanager includes integrated support for aggregating and muting repetitive alerts so you won't be inundated when multiple events occur in a short timeframe.
Alertmanager is configured independently of the main Prometheus system. You set up the alerting rules in Prometheus, determining the conditions when a metric should send an alert to Alertmanager. The latter component then gets to decide whether the alert should be delivered to each configured platform.
What Can't Prometheus Do?
While Prometheus is a comprehensive monitoring solution, there are some roles it's ill-suited for. Prometheus is engineered with reliability and performance as its core tenets. This leads to trade-offs in the accuracy of metrics.
Prometheus does not guarantee the collected data will be 100% accurate. It's intended for high-volume scenarios where occasional dropped events don't influence the bigger picture. If you're tracking sensitive statistics which need to be correct, you should use another platform for those metrics. You could still adopt Prometheus for the less critical values in your system.
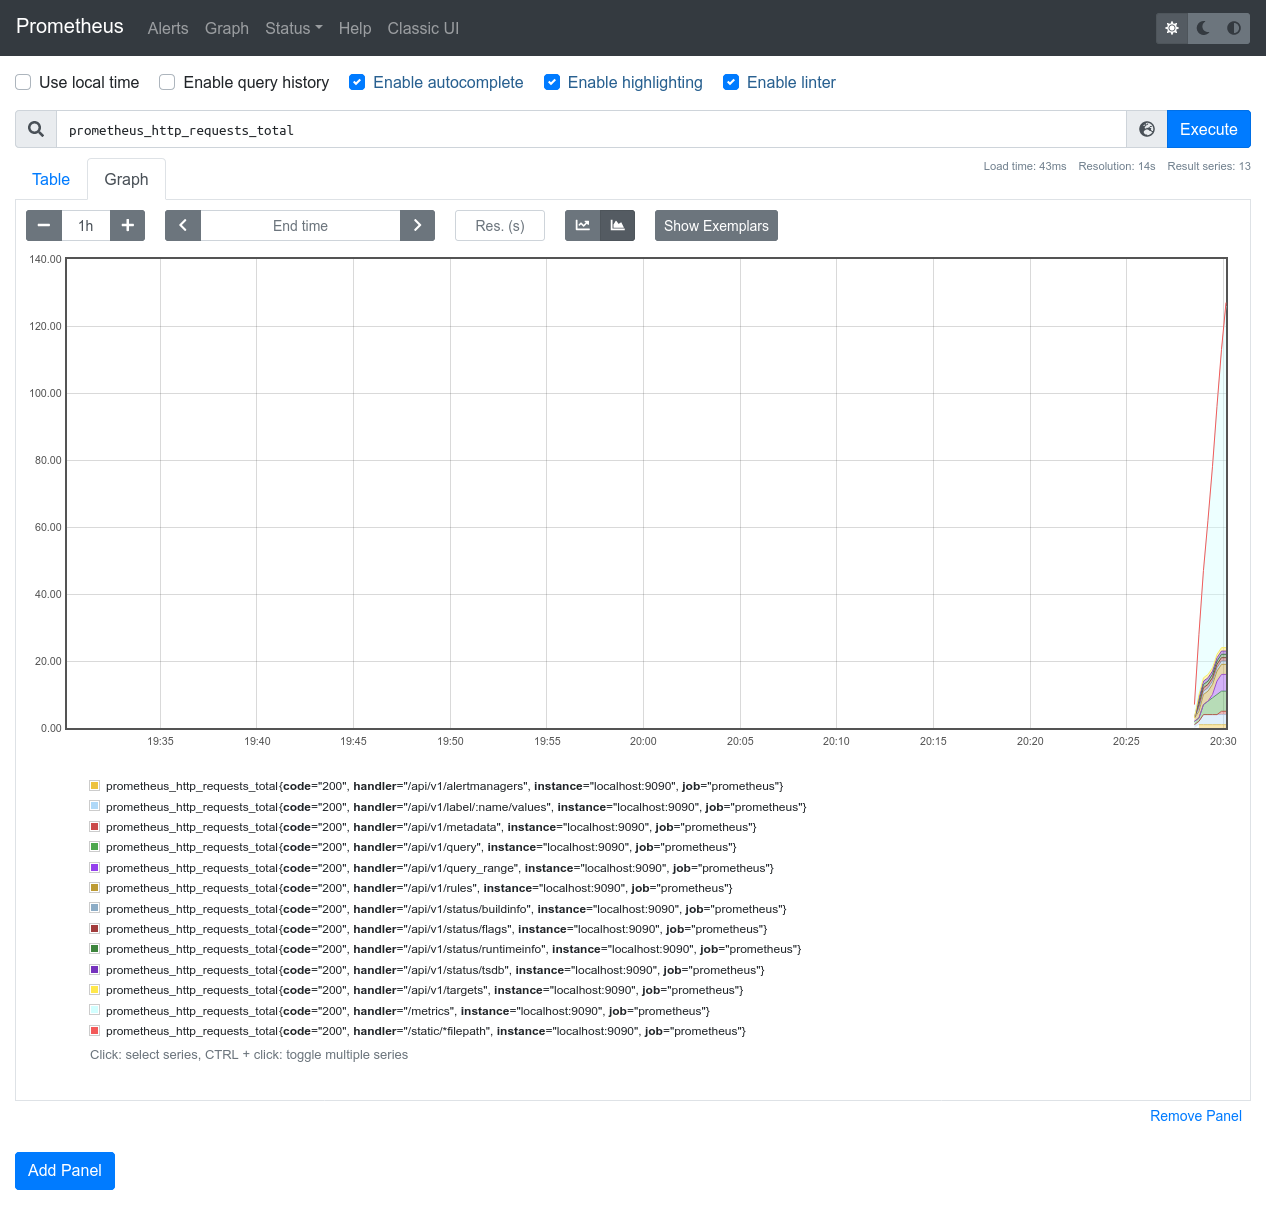
Furthermore, Prometheus may not be the only component you want in your monitoring stack. It's focused on storing and querying your events, primarily using HTTP APIs. The built-in web UI provides basic graphing capabilities but can't support advanced custom dashboards. Data visualization scenarios are usually handled by deploying a Grafana instance alongside; this provides dashboarding and metric analysis capabilities with built-in Prometheus integration.
Conclusion
At its simplest, Prometheus is a time series data store which can be used for managing any sequential time-based data. It's most commonly used to monitor the metrics of other applications in your stack. While Prometheus is an effective system for storing and querying metrics, it's usually integrated with other solutions to power graphical dashboards and advanced visualizations. Its popularity is down to its ability to work with custom metrics, support rich queries, and interoperate with other members of the cloud-native ecosystem.
Prometheus aims for maximum reliability. It's designed to be your go-to tool during an incident that helps you understand why other components are failing. Individual Prometheus nodes in a clustered deployment are fully autonomous with no dependencies on remote storage. As a consequence of its dependability, Prometheus doesn't guarantee data accuracy. This drawback should be your primary consideration when planning a new deployment.
While we've not covered the practical steps of installing Prometheus in this article, the official documentation provides a comprehensive quick-start guide if you'd like to try the system yourself. Prometheus is commonly deployed as a Docker container but is also available from source or as pre-compiled binaries for popular Linux distributions. The Dockerized approach is easiest to work with as it includes all core components in a ready-to-run configuration.


