Grafana is an open-source observability platform for visualizing metrics, logs, and traces collected from your applications. It's a cloud-native solution for quickly assembling data dashboards that let you inspect and analyze your stack.
Grafana connects to a variety of data sources such as Prometheus, InfluxDB, ElasticSearch, and traditional relational database engines. Complex dashboards are created by using these sources to select relevant fields from your data. Dashboards can incorporate a varied range of visualization components such as graphs, heat maps, and histograms.
In this article, we'll cover what Grafana does and when it should be used. It's important to recognize there's no universal use case though: Grafana's used to analyze your data, so every installation will work differently and be tailored to the specific dataset it's showing.
What is Grafana?
According to developer Grafana Labs, the product is a "complete observability stack" that gives you everything you need to interact with your data. That might be real-time graphing of time series data from sources such as Prometheus, analysis of events in software log files, or using a custom plugin to pull out deep insights from a SQL database.
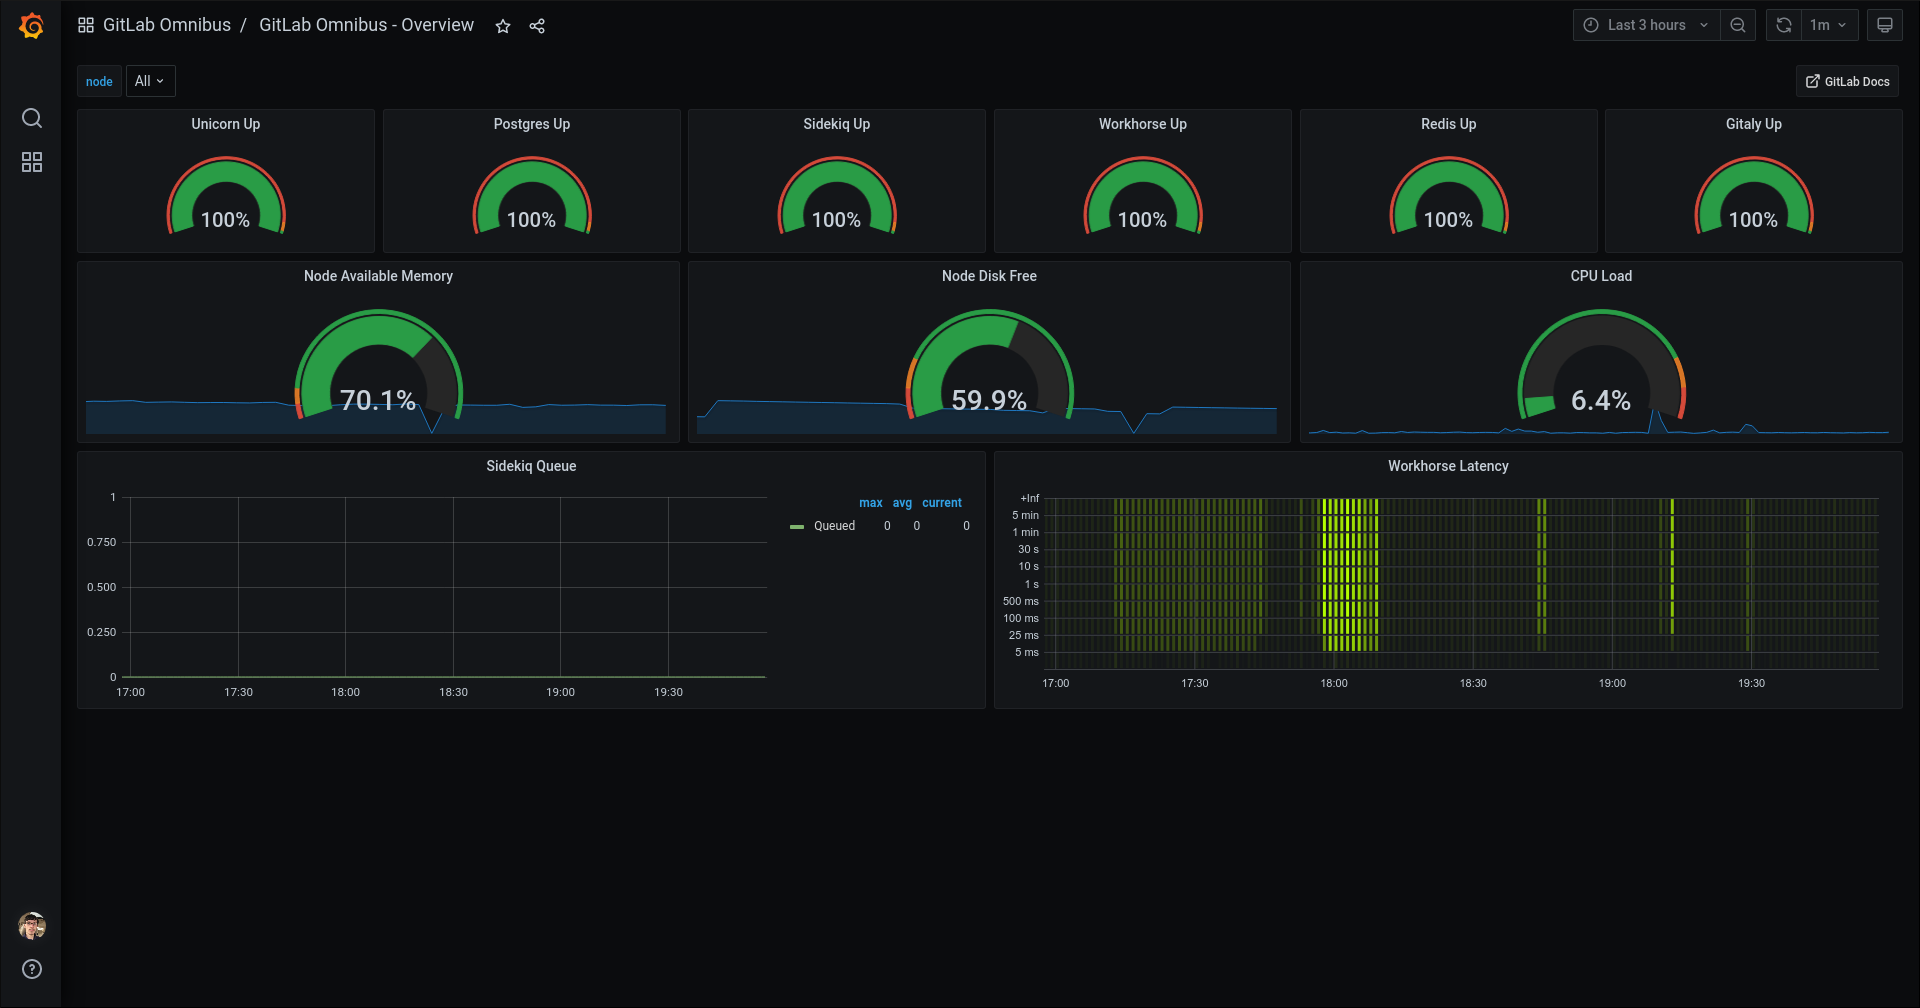
You interact with Grafana via highly visual dashboards. Each dashboard is built from modular panels that you connect to your data sources. A single dashboard can surface metrics from multiple sources simultaneously, letting you track your entire stack from one view.
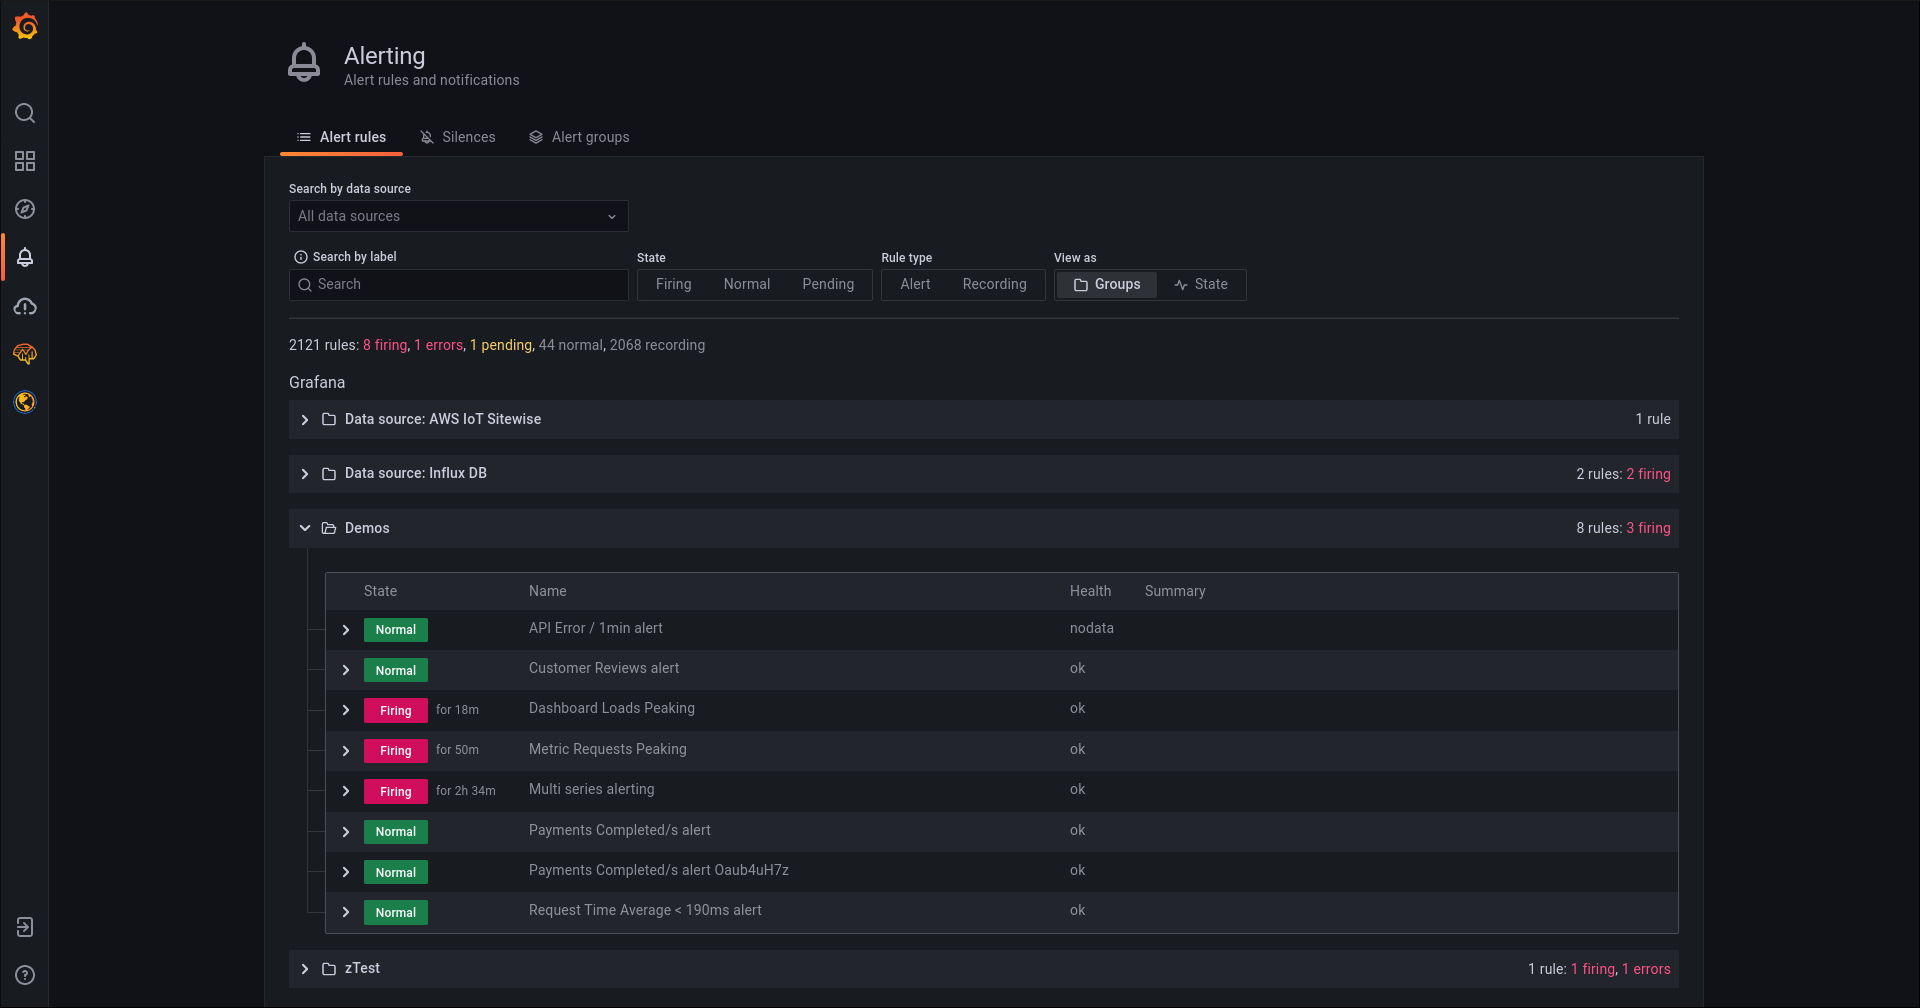
Grafana includes an integrated alerting solution to warn you of problems as they occur. Notifications can be sent to several targets such as email, Slack, and webhooks. Grafana can consume existing alert rules defined by Prometheus, Loki, and Alertmanager, offering a central monitoring view.
You can host Grafana on-premises with your own hardware or use the managed Grafana Cloud service. If you're self-hosting, you can run Grafana on Linux, macOS, and Windows, or use Docker or Kubernetes for a containerized cloud-native installation.
Here's a minimal example of starting a Grafana server using Docker:
docker run -d --name=grafana -p 3000:3000 grafana/grafana
This uses the official Grafana Docker image which listens on port 3000. Visit http://localhost:3000 in your browser to login; the default credentials are admin/admin. You can then follow the getting started guide to add your first data source and create a dashboard.
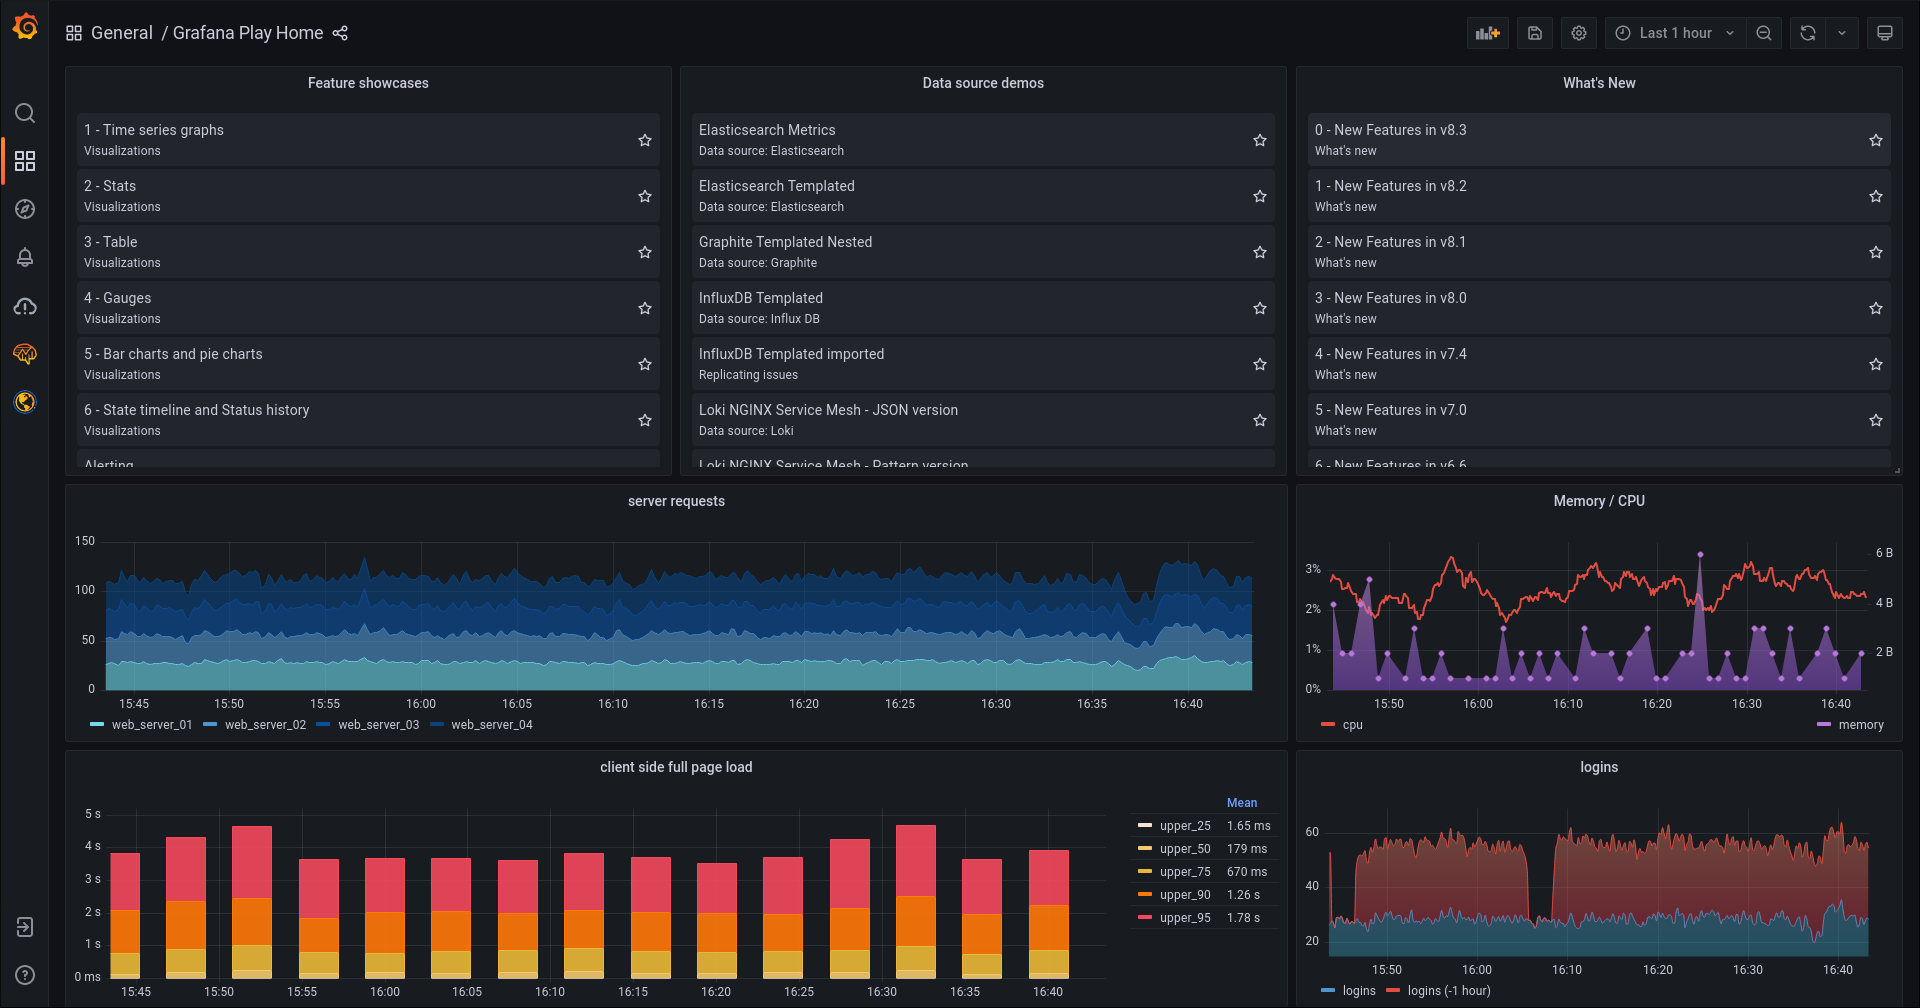
If you've not got Docker installed, you can try out Grafana using the public playground instance. This surfaces some metrics relating to the Grafana Cloud service. It's a good example of a populated dashboard that uses several different visualizations.
When Should Grafana Be Used?
Grafana is most commonly used as an infrastructure monitoring tool that lets you keep tabs on application performance and error rates. Visual dashboards make it quick and easy to assess whether your stack's operating normally, giving you real-time insights without having to manually sift through data points.
Grafana is great when humans need to consume large amounts of raw data with minimal effort. While your other tools like Prometheus may already have some degree of data analysis support, Grafana gives you a single purpose-built platform that goes from overview dashboards to advanced source interrogation.
Another key use case is when you've got multiple sources that you want to access in aggregate. Grafana excels here, letting you locate time series events, log entries, and custom queries alongside each other for immediate consumption. You could build an overview dashboard that shows hardware resource utilization, important log lines, and a graph of new user sign-ups in your database on a single screen. This would give you one destination to head to when you need a summary of everything that's happening in your organization.
Other Considerations
Grafana helps facilitate data-first approaches to engineering and operations. While that doesn't mean you shouldn't use it for simple dashboards and monitoring solutions, you will get the most benefit when viewing high volumes of data from several sources.
The views you use should be specific to your organization and objectives. It's worth writing down what you want to track and how it should be visualized before you start assembling a dashboard. Surfacing the wrong data is as unhelpful as having no data at all.
As you build out your dashboards, you might come across data black spots. These arise when part of your stack isn't providing metrics or they can't be consumed via a Grafana data source. If the component is critical to your application, it's worth taking the time to add proper instrumentation so it can be monitored with Grafana. Otherwise people could be given a false sense of security if your dashboards aren't telling the full story.
Conversely, don't try to cram your dashboards full of data. Grafana is meant to make data easier to understand; having too much of it accessible at first-glance can be overwhelming, making it harder to interpret what's going on. Each of your dashboards should have a specific purpose which can usually be defined as a question.
If you've got a dashboard for "which servers are low on storage?", limit its panels to just the metrics that actually concern storage use. Adding CPU and memory graphs too will make the important information less visible. It's better practice to add a second dashboard that answers the question "which servers are at risk of performance issues?"
It's also important to consider Grafana's impact on the infrastructure components it visualizes. Data retrieval from your databases and monitored services creates an overhead that could impact those resources. Avoid refreshing data sources more often than needed. If you've got a graph of "transactions completed today," it probably doesn't need to be updated every few seconds. Settling for less frequent refreshes will reduce the load placed on your infrastructure.
The Bottom Line
Grafana is a data analytics solution for combining, analyzing, and visualizing data from all the sources that are relevant to you. It has integrated support for over 15 popular databases and monitoring solutions. The metrics collected from your data sources are displayed as modular panels in approachable dashboards, creating views which anyone can understand.
Using Grafana for your analytics addresses several of the issues associated with data-driven DevOps. Collected data often goes unused if it's inconsistent, scattered across different platforms, or too complex for team members that aren't data specialists to query. Grafana unifies all your data into one platform that also gives you the tools to explore events and build useful visualizations.
Grafana's become popular as it lets you put your data to use. Organizations and teams which make effective use of data are better equipped to spot patterns, make targeted improvements, and enhance their overall effectiveness. Grafana dashboards contribute by letting product managers, data analysts, and developers access shared views that keep everyone on the same page.


