If you're one of the many programmers who debug using
console.log
, or something similar, you're missing out on a lot of features that debuggers can offer. If you're often getting stuck tracking down logic bugs, you may want to try using this feature of your IDE.
Moving Past console.log
Of course, logging debug output to the console is very necessary in many situations. Sometimes, it's good to just log an object and check out the value it's set to, which can solve many basic problems.
However, the second it becomes more complicated than that, a debugger can be useful. Debuggers allow you to set breakpoints in your code, and step over the execution. They also allow you to inspect the memory of your application as it changes with function execution. This can be crucial to tracking down problems.
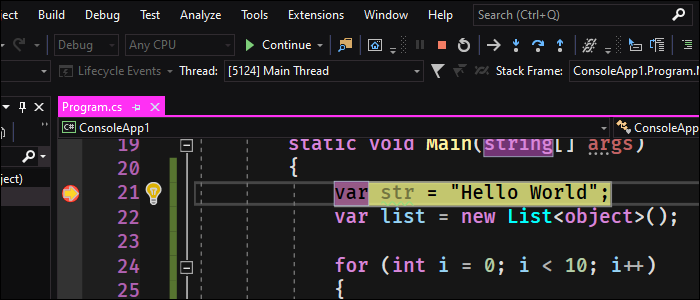
They're pretty simple to use. The exact implementation will depend on your IDE, but most allow you to set breakpoints by clicking on the sidebar, which will display a red circle usually to indicate that the code will stop there.

Then, you can just click start, and the debugger will pause whenever the breakpoint is reached (if it ever is). For example, you could set a breakpoint when a certain button gets pressed, and the program would run normally until the button was pressed. After the breakpoint is reached, the program is paused entirely.
While it's paused, you can view the variables of the application. This is configurable, and automatically set to what Visual Studio thinks is useful. You can manually watch variables, or just view the local variables.

In this case, it's useful to view the raw data for the class. The list class, for example, seems to just be an
object[]
. However, in practice it has a lot of other variables on the class itself. Not enough to matter of course, but it's interesting to be able to see everything that gets allocated.
Step Into, Step Out, Step Over
Of course, just pausing the program isn't too useful, so debuggers will have tools to essentially play back execution frame by frame, in this case, line by line.
You'll find the controls in Visual Studio up at the top here, underlined in red.

These all do different things.
- Step Into will cause the debugger to go line by line, but also show you basically every line that gets executed. If you call one of your functions, it will move into, or "step into," that function. Once the function returns, it will step out.
- Step Over also goes line by line, but in this case is confined to the current scope. It will not go into function calls, instead just going to literally the next line in your source code, no matter how many functions ended up being called.
-
Step Out basically fast forwards until the next
return
Using these three controls, you have full control over the program, and can view as much or as little of the execution as you want.
Meanwhile, as you're stepping around code, you can view the memory and local variables for each function, examine their values, and see how they change as you step forward in time.
Conditional Breakpoint Settings
In Visual Studio, breakpoints can be more than just "stop on this line of code." You can set conditional breakpoints that will only activate when certain conditions or values are met.
Right click on a breakpoint and select "Conditions."

From here you can set an if statement that will be checked before running the breakpoint.
