Quick Links
Infra App is a desktop Kubernetes client for Windows, macOS, and Linux. It offers a clean and simple UI that lets you monitor clusters and inspect the resources within them.
Infra App is free to use with a single Kubernetes cluster. You can access all the app's features without entering any payment details. The Pro plan is priced at $100/year. It can connect to an unlimited number of clusters and freely switch between them.
Getting Started
Head to the download page to get the right Infra App package for your system. Two options are available for Linux: a Debian archive or a self contained AppImage.
Install the Debian archive with the following command:
$ sudo dpkg -i infra_latest_amd64.deb
Infra should now show up in your app launcher.
To use the AppImage, first make it executable and then launch the binary directly:
$ chmod +x infra-latest.AppImage

            $ ./infra-latest.AppImage
You'll be prompted to enter your email address when you start Infra for the first time. This will be used to manage your subscription. You'll be automatically enrolled into a 30-day trial of the Pro plan if you haven't used Infra before.

Adding and Selecting Clusters
Infra will automatically discover existing Kubernetes cluster connections defined by Kubeconfig files in your ~/.kube/config directory. It also has integrated support for clusters created by Minikube and Docker Desktop, as well as Amazon EKS and Google GKE configs defined by their respective CLIs. All these cluster types should appear without any extra work.
You can manually add a Kubeconfig file to the app by pressing Ctrl+O or clicking the three dots icon in the top-left corner and choosing File > Add Configuration.
Available clusters are displayed in the dropdown in the top-left. The selected cluster and its connection status is permanently displayed. To change cluster, click the dropdown and choose a new config from the list.

Infra connects to your cluster using the Kubernetes API server and the credentials in your Kubeconfig file. It doesn't install anything inside your cluster. You should connect as a user with full cluster access to get the most functionality. A complete list of required RBAC permissions is available within Infra's documentation.
Infra works best when the Kubernetes Metrics Server is installed in your cluster. This provides an API for per-object CPU and memory consumption that Infra uses throughout its interface. You can use this command to add Metrics Server to an existing cluster:
$ kubectl apply -f https://github.com/kubernetes-sigs/metrics-server/releases/latest/download/components.yaml
Some Kubernetes distributions bundle Metrics Server as an optional addon. Here's how to activate it in Minikube:
$ minikube addons enable metrics-server
Always use your distribution's integrated solution when available to avoid incompatibilities.
Browsing Cluster Objects
Infra has two main screens: Browse and Utilization.
The Browse view provides a tabular overview of the objects in your cluster. It defaults to showing Pods and Deployments on the "Applications" tab.

Switching to the "All Resources" tab at the top of the screen will show you everything, including ConfigMaps, Ingresses, Secrets, and internal objects like Roles and RoleBindings.

All the table columns are sortable by clicking their headers. You can quickly jump to a known object using the searchbar in the top-right.
The Browse screen can get noisy when you've got many resources in your cluster. You can filter to a specific namespace using the links in the left sidebar. Clicking a namespace will show a variant of Browse that's scoped to the selected option.

Clicking an item within a table of objects will display a new screen containing its details. The information available depends on the kind of object you've selected. Most present a basic YAML editor but Pods and Deployments show a graphical view of their resource utilization and lists of related components such as Services and ConfigMaps.

You can view the Pod's logs and event stream using the tabs at the top of the screen. Logs are automatically tailed in real-time and can be searched using the searchbar in the top-right.

Infra can provide direct shell access to Pods too. Click the three dots icon next to a Pod or Container and select the "Open Shell" menu item. A new terminal will appear at the bottom of the Infra window. You can continue browsing other screens in Infra as you interact with the terminal.

You can edit objects by viewing their YAML, clicking the Edit button in the top-right, and then pressing the blue "Apply" button when you're ready to save. Infra will submit the new manifest straight to your cluster.

Monitoring Cluster Utilization
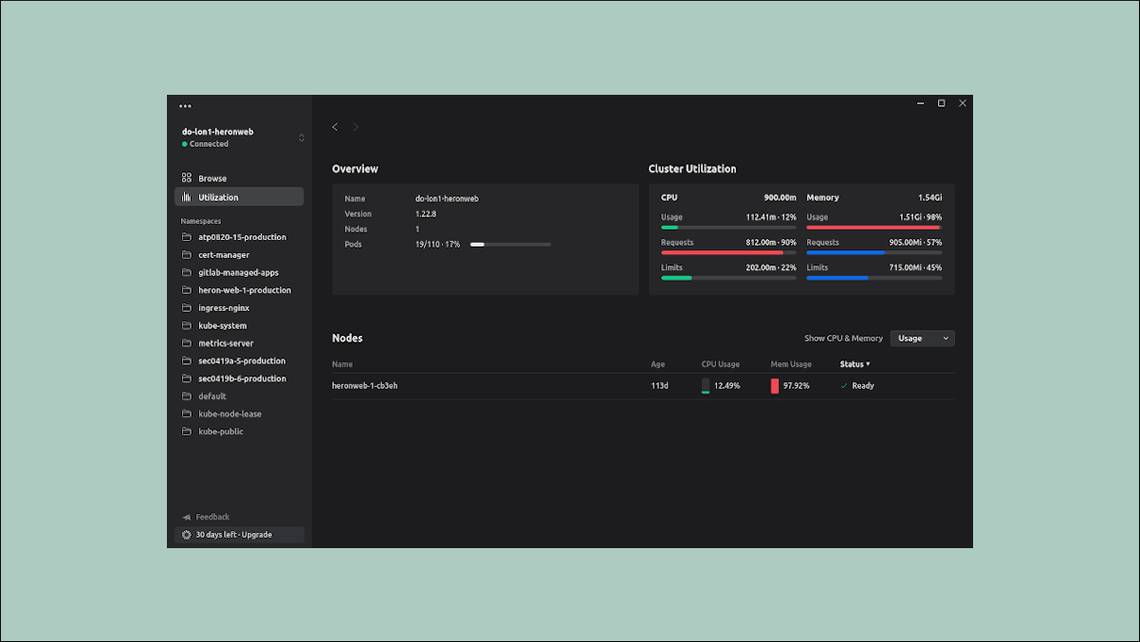
Infra's Utilization screen, accessed from the top of the left sidebar, provides a graphical overview of CPU and memory utilization inside your cluster. A breakdown of current usage, requests, and limits is displayed in the top-right.

Your cluster's Nodes are shown in a table at the bottom that can be filtered to switch between the three metrics. Clicking a Node displays a screen showing its utilization, assigned IP addresses, and a list of the Pods it's hosting.

Resource utilization statistics also feature heavily throughout Infra's various object browsing screens. Each item displays a visual indication of its current CPU and memory usage, helping you spot anomalies and detect when capacity changes are required. Tables can be filtered by CPU and memory so you can easily spot the objects that are having the biggest impact on your cluster.
Summary
Infra App is a convenient way to manage Kubernetes clusters and the objects within them. Infra's interface is cleaner than rivals like Lens and there's a strong focus on applications and cluster utilization. You can easily visualize the resource consumption of each Kubernetes object.
Arguably the biggest drawback is that Infra is commercial closed-source software. You won't be able to audit it or build your own customizations on top. The app offers seamless multi-cluster support but this is only available on the paid plan. While its licensing model means it won't suit all organizations, Infra is still worth looking at for individuals and newcomers seeking a simpler Kubernetes UI.