Quick Links
Amazon charges you when your EC2 instances serve content out to the internet or transfer data between regions. If you're running a web server on EC2, this can quickly become a major cost. Here's how to keep track of your bandwidth usage.
EC2 Bandwidth Costs Money
Data coming in is free, but data going out from your instances is taxed. The exact price depends on the region, but it's $0.09 per GB for most. You get 1GB of usage for free (even if your free tier has expired), and the price is discounted after you hit 10 TB transferred.
Data transferred between regions costs $0.01 to transfer to US East and $0.02 for everything else. Data transferred between availability zones costs $0.01 in each direction. Transfers within availability zones are free, but if you're using public IP addresses for transfers (rather than private addresses) you'll have to pay the same $0.01 bi-directional tax. Make sure your machines are all in the same zone and using private addresses to communicate between themselves.
If you've got a lot of data, you may want to consider hosting your static assets in S3 and serving them through CloudFront. S3 storage is cheaper than the EBS volumes used for EC2, and CloudFront only costs $0.085 per GB, a minor cost reduction. But, CloudFront also has a 50 GB free tier, and S3 to CloudFront transfers are free.
How To View Your Bandwidth
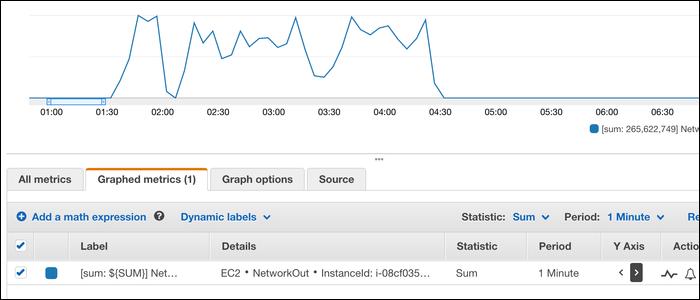
AWS makes this much harder than it needs to be. Technically, you can view your bandwidth usage in CloudWatch, Amazon's built in analytics tool. Under Metrics > EC2, you can find the "NetworkOut" metric for the EC2 instance you want to monitor. Make sure this graph is set to "Sum" rather than "Average," which will display the total network out rather than average speed. You can break it down by a time period, and narrow in by dragging to select points on the graph:
From CloudWatch, you can set up alarms which will notify you of any anomalies, such as bandwidth spikes that may be costing you extra money.
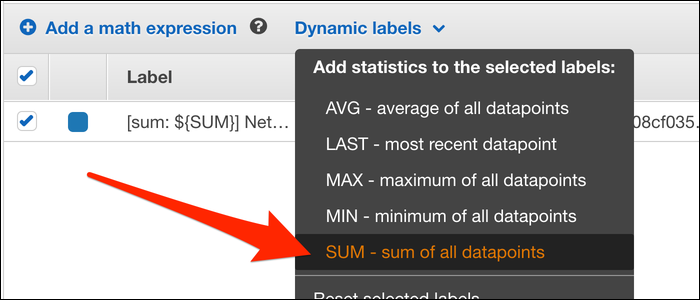
Here's the problem---there's nothing that shows the sum of all points, you're stuck with a line graph. None of the math expressions do anything to help; the only way to actually view the cumulative sum over a period in CloudWatch is by creating a Dynamic Label that uses the SUM function:
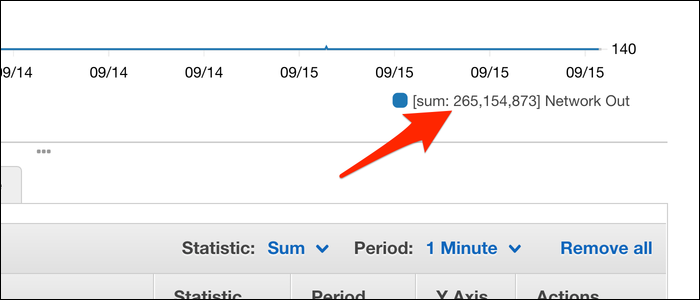
This will show the SUM right below the graph, next to the name of the metric:
It's in total bytes though, so you'll need to break out your calculator and divide by 1024 to find KB, again to find MB, again to find GB, and so on.
The dynamic label can be very misleading and hard to use. If you select "last 7 days" as the time period, and then select a region with your mouse to zoom in on a particular event, the dynamic label doesn't update. You need to manually specify a time period such as "2019-09-13 04:42 - 2019-09-13 05:42" to get an accurate measurement.
How to View The Actual Cost of EC2 Bandwidth
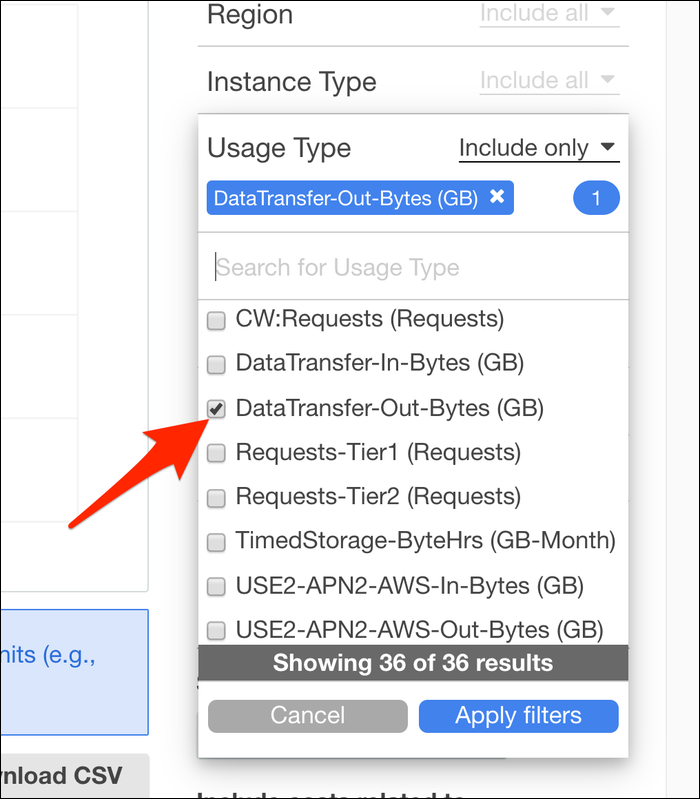
If you want to view how much bandwidth is actually costing you, you can do so in the Cost Explorer. From the "Cost & Usage" tab, you can add a filter by "Usage Type" and a filter for "EC2" to narrow the bandwidth cost to just your virtual machines.
You can set the time range to show a more accurate graph, as the default is set to last six months.

