Tracing a computer program is not reserved for only those who have the source code, can read it, and know how to use a debugger. Any Linux user can trace an executable with strace. Find out how!
What Is strace?
strace is a Linux utility that lets you trace the system calls that a given application makes. It will also pick up on signals and produce a detailed output of all the information that it observes.
A person new to strace and tracing, in general, might ask why this is helpful. A professional IT engineer might ask how much information strace can really pick up, especially if they know how much can be glanced from a debugger like GDB.
If you are interested in debugging computer code and programs, take a look at our Debugging with GDB: Getting Started article.
There's good news in both cases! Tracing all system calls and signals provides a comprehensive picture of a program's operation, and it's an excellent troubleshooting and even debugging tool. Additionally, it runs during runtime (as a wrapper process), yet can trace easily into a logfile and makes for an easy-to-digest overview of a program's actions.
Comparing this with GDB, which is also a wrapper process, things are substantially different. For example, in GDB, one could trace a program step by step (for example, one line of code at a time or a logical block of code---or by using breakpoints in the code). However, such steps are made during runtime, whereas strace simply runs the program as a whole until some error occurs or until completion.
The engineer or user can then go and analyze the full (text-based) log, search for interesting strings, etc. Additionally, GDB would allow one to see signals and system calls also, although setting that up and analyzing the same is much more complex than with strace.
With strace, you can simply execute the program under strace (i.e.
strace some_program
), and while this is about the same as GDB, the operation differs significantly, as described above.
As for the amount of information that can be glanced from a trace, it's good to take a step back and remember where most computer problems come from---disk full, memory exhausted, some file wasn't found, incorrect input, etc.
Especially in the areas of disk access, strace really shines. As it records all system calls, every disk access is very visible in the log. Again, you can search for relevant text strings and file names, although be aware that sometimes, strings could be length-reduced, so only the partial output might be visible.
In summary, if we had to rate strace as either a debugging and/or troubleshooting tool and assign it a place into a newer or more proficient Linux user toolbox, then in both cases, the answer is approximately in the middle, although leaning a bit more toward troubleshooting than debugging. Let's install strace next.
Installing strace
To install strace on your Debian/Apt-based Linux distribution (like Ubuntu and Mint), execute the following command in your terminal:
sudo apt install strace
To install strace on your RedHat/Yum-based Linux distribution (like RHEL, Centos, and Fedora), execute the following command in your terminal:
sudo yum install strace
Using strace
After installing strace, it's quite simple to get started. We can, for example, trace the Linux
sleep
command/utility:
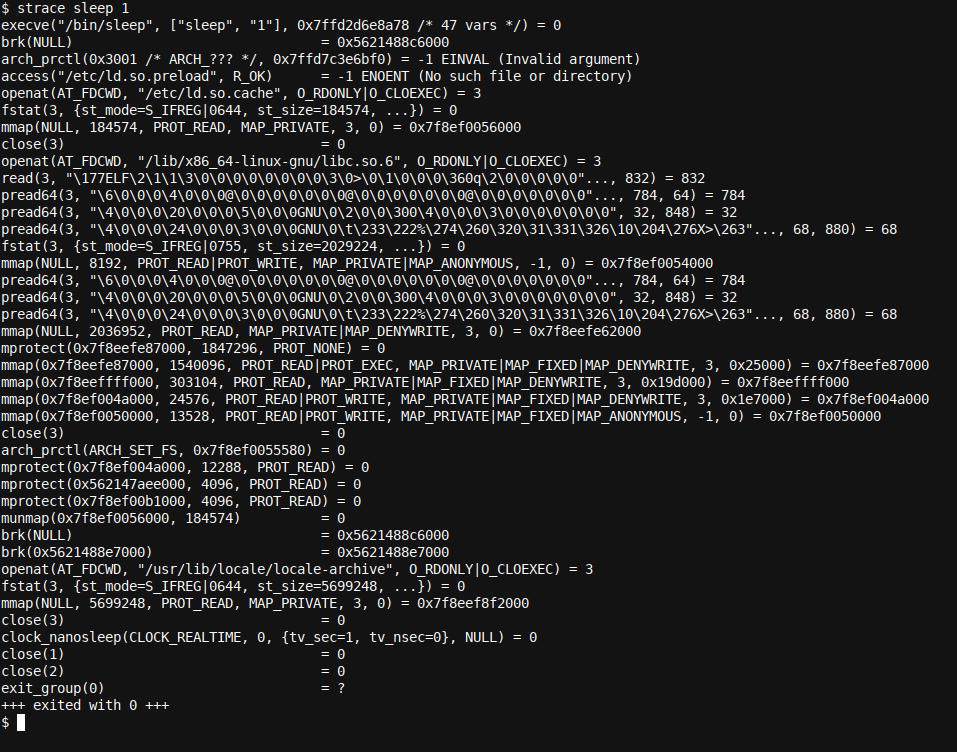
strace sleep 1
Immediately, the output proves the statement made above. There's a plethora of information on all of the actions taken by the (very) simple sleep 1 command, which, after all, only actions sleeping for a single second.
Let's look at a few things that we can immediately observe:
access("/etc/ld.so.preload", R_OK) = -1 ENOENT (No such file or directory)
We can see that quite shortly after starting, the program tried to access (on disk) the file /etc/ld.so.preload. We can also see that this failed (-1 status), as the file wasn't found (ENOENT) with the descriptive error message No such file or directory.
Just this single line of output could lead to further research. For example, we can scan our favorite search engine for what the file /etc/ld.so.preload is/does and what happens when a program can't find it, as well as for how we can install it.
As you can see, if you would run a more complicated software/program under strace, you might find that it's trying to access a file---for example, a shared .so library---and can't find it. It's easily analyzed and likely easily fixed thanks to strace.
Next, we see the conf.d binary cache being opened successfully as read only (O_RDONLY), with the close-on-exec flag (used in multithreaded programs to avoid race conditions) O_CLOEXEC flag set:
openat(AT_FDCWD, "/etc/ld.so.cache", O_RDONLY|O_CLOEXEC) = 3
Even if one doesn't know what each item means, a simple search online will quickly provide information on each specific term or word, helping one to understand the information presented and what's happening.
Also of particular interest is this line toward the end:
+++ exited with 0 +++
This indicates that the program exited successfully with exit code 0. An exit code of 0 generally indicates successful execution and termination in Linux programs.
As you can see from the examples above, it's easy to see what a program is doing by using strace. Each line and even each word in each line can be analyzed, and often, a search engine is required to shed some light. However, even glancing over the output of a failing program might be enough to find the exact cause and fix it, and especially so when, for example, a required file is missing, etc.
Tracing Child Processes
When using strace, it will sometimes seem that strace is not correctly tracing all of the program's system calls, etc. This could simply be because the program being traced has initiated/started a number of child processes, for example, by forking child processes.
It's simple to include these child processes in the strace capture: Simply add the -f option to the command line (i.e., strace -f your_program), and all system calls, etc., of all child processes will also be tracked.
Wrapping up
In this article, we discussed the strace tool, which can be used to make traces of any program or application running on a Linux-based computer.
After installing the tool, we can simply and directly start the program under strace and enjoy the high level of troubleshooting and debugging information that the strace wrapper will present us with.


