Interesting in fixing those library errors and bugs you observe when installing a cool new program on Linux? Check out this article which shows how to use ltrace, arming you with the tool needed to debug library calls.
What Is a Library?
Most people are familiar with
.dll/.DLL
files (Dynamic Link Libraries) in Windows. The Linux equivalent is a
.so
file, a Shared Object, often referred to as just Library.
A library can be used by an application allowing that program to utilize functionality from outside its program code. For example, a web server may want to use a disk I/O library written by the operating system vendor or another third party. It is a way of sharing common goods and interests in most, if not all, operating systems.
Libraries can be loaded either dynamically at run time (when the calling program is starting, for example), or they can be compiled into a target application/binary. They will thus always be loaded (whether used or not), as part of, and whenever the application which has them compiled-in/built-in is started.
To learn more about libraries, their dependencies, and the ldd tool, you may like to read about how to work with shared object dependencies in linux. The ldd tool is another handy tool to have in any more advanced Linux user toolbox.
what is ltrace?
There are various trace utilities in Linux, like strace for tracing system calls and signals and the
traceroute
to trace network routing. The ltrace utility/tool traces all library calls.
If you have read our working with Shared Object (Library) dependencies in the Linux article (linked above), you will have already seen how you can find out what libraries a particular binary is linked to by using the ldd tool. The purpose and functionality of ltrace is somewhat different; much in line with
strace
, the ltrace command traces all library calls a particular program is making while it is executing.
Alike to
strace
, we can start a program under (think about it like a hierarchy) ltrace. We simply specify the program which ltrace should start as the first option to ltrace, and ltrace will start that program for us and immediately commence (on a higher level) to track all calls to any (operating system or third party installed) libraries.
It does so by intercepting and recording the dynamic library calls made by the program being executed. It will also track any signals sent to the program being executed, very similar to
strace
(and, if so desired, this functionality can be disabled by specifying the
-b
or equivalent
--no-signals
option to ltrace).
Note that the term dynamic is of significant importance here; ltrace will trace calls to external libraries (under the form of
.so
or
.a
files), i.e. libraries not directly compiled into a program; dynamic libraries. Thus, if you have a binary with statically (compiled-in) libraries, ltrace will not be able to see/trace such internal calls.
Installing ltrace
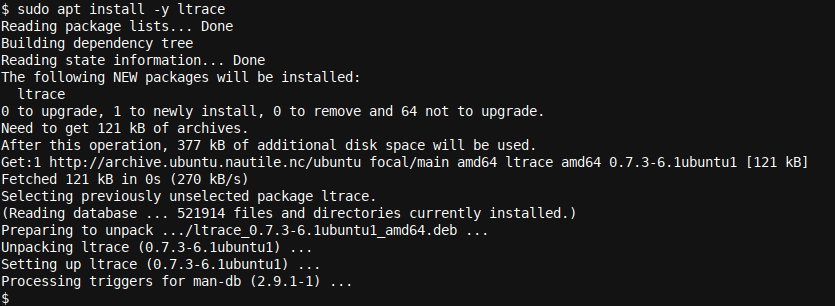
To install ltrace on your Debian/Apt based Linux distribution (Like Ubuntu and Mint), execute the following command in your terminal:
sudo apt install ltrace
To install ltrace on your RedHat/Yum based Linux distribution (Like RHEL, Centos and Fedora), execute the following command in your terminal:
sudo yum install ltrace
Using ltrace
Let's set up a small test environment:
sudo apt install tar xz-utils

            mkdir ~/workspace && cd ~/workspace

            touch a b c
Here we installed tar and xz by installing xz-utils (you can use sudo yum install tar xz instead if you are using Centos/RHEL/Fedora). Next we created a directory ~/workspace and jumped into it. We then made three empty files using the touch command, namely files a, b and c.
Let's start by compressing our three files into an (tar combined and xz compressed) archive.tar.xz archive, whilst executing the same under ltrace, and observing the ltrace output:
ltrace tar -hcf --xz archive.tar.xz *
We only see a small amount of output. We can see that our program terminated successfully (the archive file was created), i.e., status 0: an exit code of 0 always means success in Linux (though the program needs to have exit codes implemented correctly).
This is not very useful this far. Reasoning for a few seconds about how tar will operate here will quickly reveal our next approach. The avid reader may have also understood that the tar command internally would call the xz command. The --xz option passed to our tar command line will ensure that the xz program is used for compression.
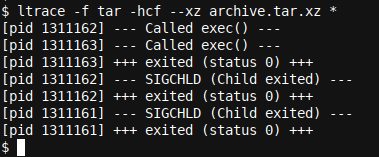
The secondary process (or the third in the overall hierarchy) namely xz (hierarchy: ltrace > tar > xz) will be started by tar when necessary. As such, we need to trace the child processes of the program running under ltrace, i.e. tar. We can do this by specifying the follow (-f) option to ltrace:
ltrace -f tar -hcf --xz archive.tar.xz *
Note that it is important to specify the -f option directly behind ltrace and not later in the command line after tar for example. The reason is that we want to specify this option to ltrace and not to the tar command. All options after the tar command are tar specific options whereas -f is an option specific to ltrace.
The output is a bit more interesting. We do not observe any library calls (of any form) yet, but we at least see that two subprocesses are forked (note exec()) and that both subprocesses terminate with status 0. Handy and all good.
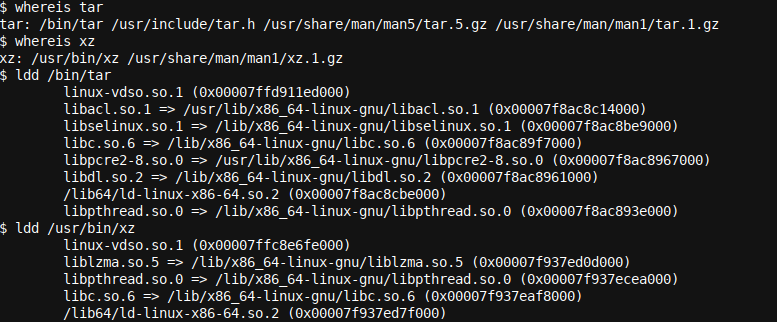
So, where are our library calls? Checking tar and xz (the two programs which will be used by the command to create the archive file) with ldd, we quickly realize that most libraries that both programs use are system libraries:
whereis tar

            whereis xz

            ldd /bin/tar

            ldd /usr/bin/xz
We must thus go one step further and enable tracing of system library calls by specifying the -S option to ltrace. This option is disabled/turned off by default as the output would get a little verbose, and it is likely assumed that system libraries are generally much more stable and, as such, do not need to be traced to start with. Let's have a look.
ltrace -fS tar -hcf --xz archive.tar.xz *
Or, for testing purposes:
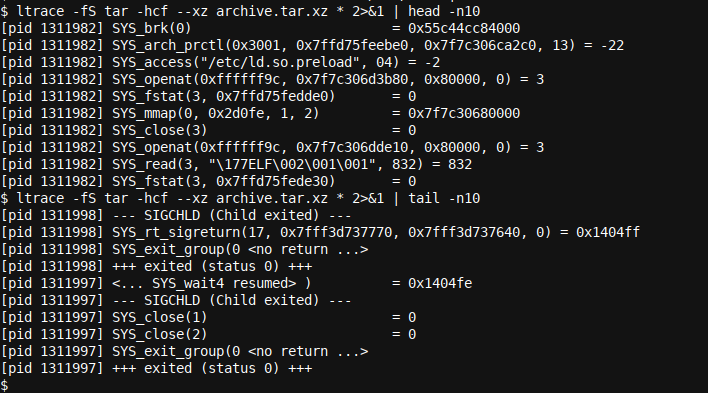
ltrace -fS tar -hcf --xz archive.tar.xz * 2>&1 | head -n10

            ltrace -fS tar -hcf --xz archive.tar.xz * 2>&1 | tail -n10
As the output was substantial we had to capture the first and last ten lines using a head and tail command. To be able to use these commands we had to redirect stderr to stdout using the 2>&1 redirection as ltrace will by default report on stderr. If you are interested in learning more about redirection see Bash Automation and Scripting Basics (Part 3).
Now that we added the -S option, we can see all libraries being accessed. For example, we see /etc/ld.so.preload being accessed. The output is sequential (top to bottom), so if there are other events (sub-processing being forked, etc.) in between, these will be shown inline at the moment they take place. We could also add the -t option for time-based output:
Wrapping up
In this article, we introduced and discussed the versatile ltrace program, which is a great tool allowing one to trace all dynamic library calls a given program makes. We installed ltrace, set up a test environment, and executed some ltrace commands with the most commonly used options.

