Sentry is a popular error-tracking platform that gives you real-time visibility into issues in your production environments. GitLab's Error Reporting feature lets you bring Sentry reports into your source control platform, offering a centralized view that unifies Sentry errors and GitLab issues.
The feature originally relied on an integration with an existing Sentry service, either the official Sentry.io or your own self-hosted server. This changed with GitLab 14.4 which added a lightweight Sentry-compatible backend to GitLab itself. You no longer need an actual Sentry installation to get error reports into GitLab.
Here's how to get started with the integrated Sentry backend. Before we proceed, it's worth mentioning that this capability might not be right for you if you're already acquainted with the Sentry dashboard. GitLab's backend is a barebones solution which surfaces errors as a simple list. It's best for smaller applications where you don't want the overhead of managing a separate Sentry project.
Getting Started
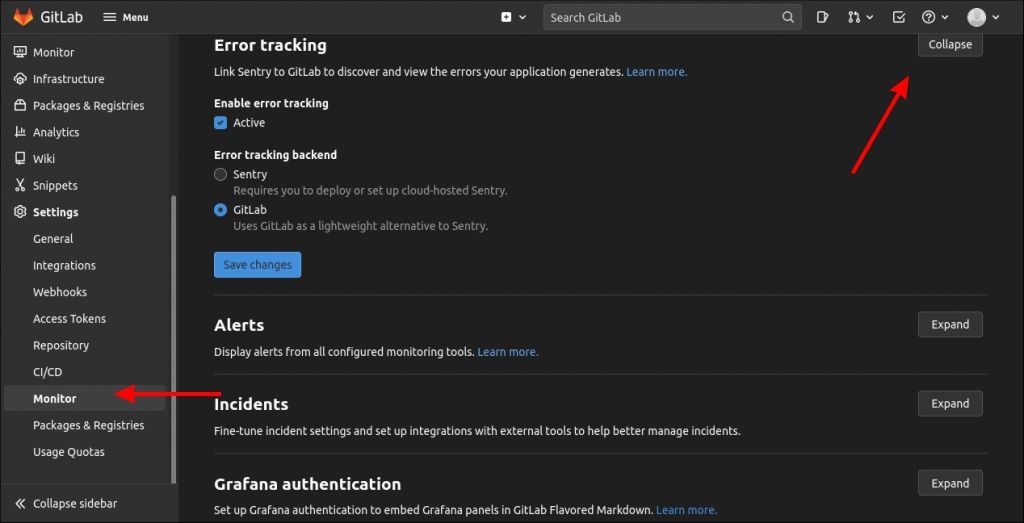
Create a new project on GitLab.com or your own GitLab server. Navigate to Settings > Monitor in your project's sidebar and then expand the "Error tracking" section. Enable the checkbox under "Enable error tracking". Make sure the "Error tracking backend" radio button is set to "GitLab". Press the blue "Save changes" button to continue.
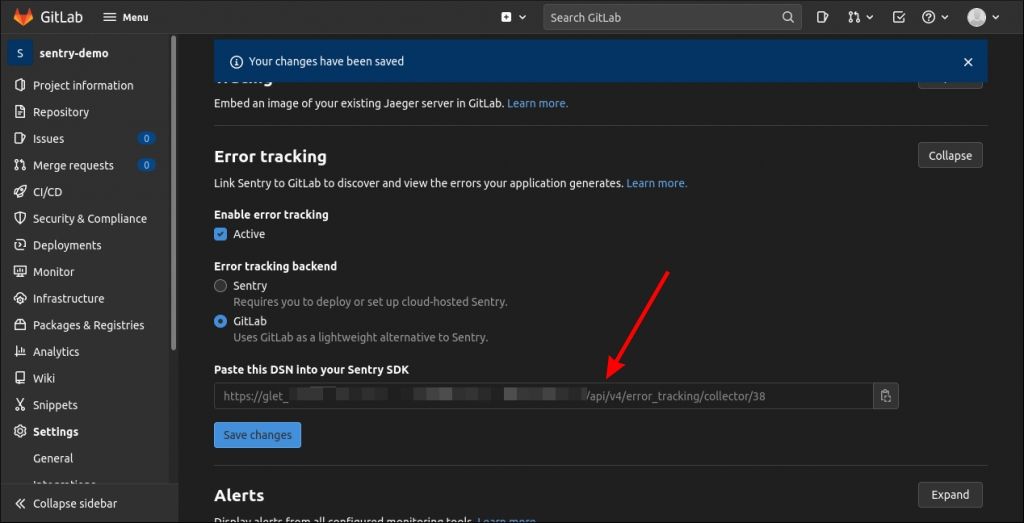
The page will reload. Now you can expand the "Error tracking" section again to reveal your DSN string. This URL is used to configure your Sentry client library to send events to the GitLab server.
Configuring the Client
Now you can add Sentry to your code. Here's a basic example using the official Sentry client library for Node.js. You can install the package by running
npm install @sentry/node
. Documentation on all the available clients is available from Sentry.
const sentry = require("@sentry/node");

            sentry.init({

             dsn: "https://glet_abc123@gitlab.example.com/api/v4/error_tracking/collector/1"

            });
Replace the DSN value with the string you copied from the GitLab UI. The part before the
@
is a special authentication token that permits access to the GitLab server. The remainder consists of the unique error tracking ingest API endpoint for your project.
Testing Your Integration
Official Sentry client libraries start capturing unhandled errors as soon as they're configured with a DSN. If any following code throws an error that you don't catch, the event will be reported to your GitLab server.
You can test the integration by manually capturing events. Here's an example that creates and reports an
Error
instance:
Sentry.captureException(new Error("Sentry test"));
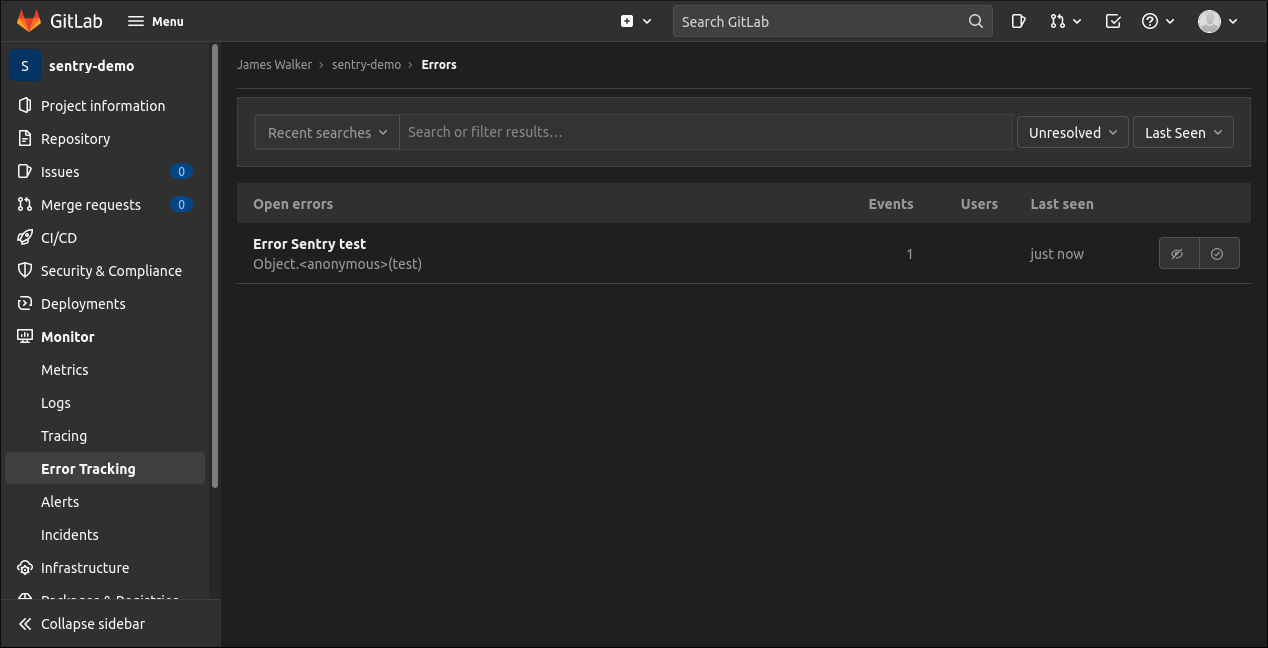
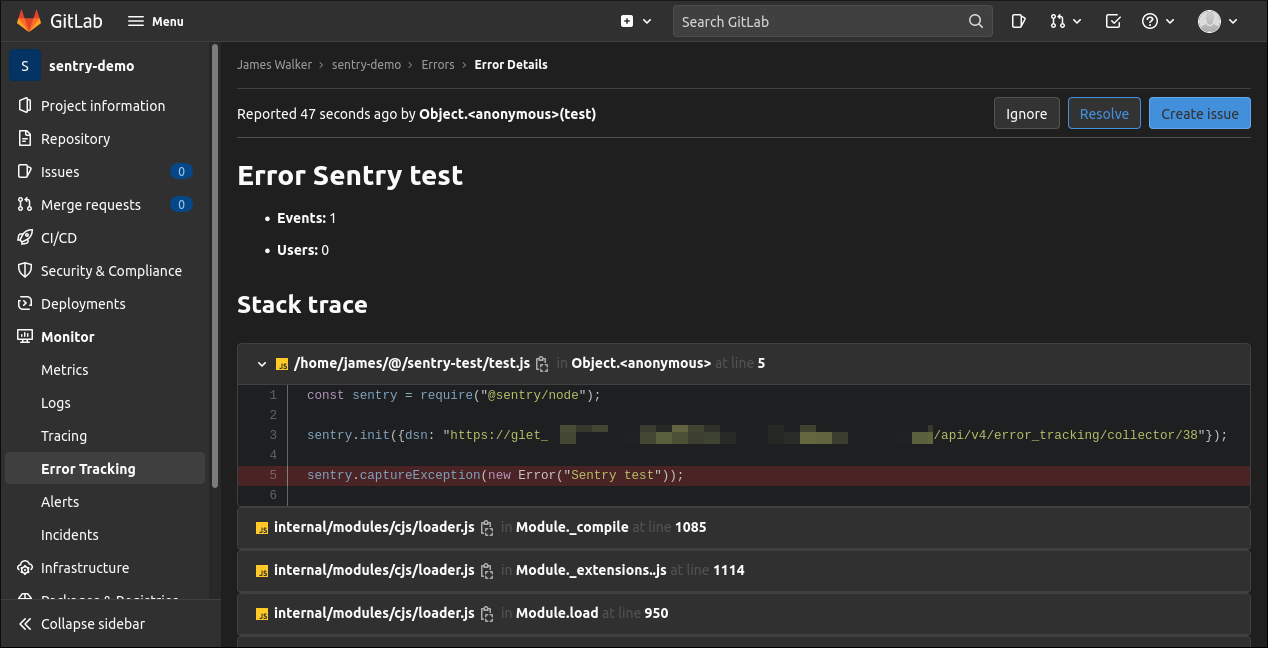
Use your project's sidebar in the GitLab web UI to navigate to the Monitor > Error Tracking page. The error you captured should show up in the list. Click its entry to view the full report and stack trace.
GitLab issues can be created from reports using the blue "Create issue" button in the top-right. This lets you assign remediation work to team members and start a discussion on the problem. The issue will retain a link to the error report and the stack trace will show inline below the issue's description.
Once you're done patching an issue, use the Error Tracking page to mark it as resolved. Issues can also be ignored if you don't intend to remedy them, perhaps because they were transient or logged by an outdated client.
Limitations
GitLab's integrated Sentry backend is currently intended for small-scale situations where deploying Sentry is seen as too complex or unnecessary. The full Sentry platform is a broad system that can take time to configure and maintain. GitLab's integration is a single checkbox in your project's settings but this simplicity comes at a cost.
The Error Tracking list is your only view into reports. You can't currently graph them, view changes in report volumes over time, or filter by individual users or clients. Detailed information shown by the Sentry UI, such as browser and server data, isn't currently supported or surfaced anywhere in GitLab.
You should also be aware that GitLab can't yet send emails for new error reports. You must manually monitor the Error Tracking page to stay ahead of the events being generated by your deployments.
As GitLab implements the core features of the Sentry API, it's compatible with most major SDKs and client libraries. As of GitLab 14.5, it's confirmed to work with Ruby, JavaScript, Java, and Python; other languages either have partial support or will be added in future GitLab releases.
Summary
GitLab's Sentry backend provides a simple way to capture error reports from your application and store them alongside your code. Although its current limitations render it unsuitable for all but the simplest of use cases, it's still a compelling option for smaller sites and personal projects that don't need the complexity of a full Sentry service.
The integrated backend could also be useful when testing Sentry integration with your code. If you're setting up a new client, or modifying settings of an existing one, you could use your GitLab server as a temporary backend so you don't pollute your primary Sentry deployment.
GitLab's Error Tracking component remains in development and is due to be expanded over subsequent milestones. This should see it evolve into a more fully fledged option that can replace standalone Sentry in a broader set of environments.


