
Azure Logic Apps provide tools for automating workflows. The solution is intended to help build corporate workflows, which are as simple as IFTTT or Zapier, meaning you can chain triggering events, outputs, and inputs together to result in some outcome.
So, if you want to monitor your website, you can do that. And that's what we are going to do in this article. We will attempt to send out a return signal every quarter-hour to an endpoint. And if the webserver respond with a probe of a large HTTP status code, we will:
- Send an alert to the developer team or yourself, letting know about the status code, and attaching a direct response from the certificate.
Prerequisites
As always, you will need some things already set up before we start the shenanigans. You should already have a personal Gmail account.
If you don't have a Gmail account, you can either create one or just continue reading for the sake of entertaining the idea. If you're interested in taking your Logic Apps to the next level, you can practically create any workflow that is pertinent to your website, and have it interact with you in an appropriate manner.
Azure Logic App Creation
To begin the entire process of creating workflows, you first have to create a Logic App that will be accountable for executing commands relevant to our goals.
- Log in to Azure Portal, and select the "New" option from the left-hand blade.
- Then go to "Web + Mobile," and click on" Logic App."
In the config blade, you should provide a name for the App. The name will be used as a subdomain for access to your Logic App, so it can only be of dashes, numbers, and letters.
- Now select the correct Resource Group, Subscription, and Location.
- Click "Create," and add an HTTP probe.
-
When the Logic App has been created, click on the link, and you will be navigated to the Logic App Designer.
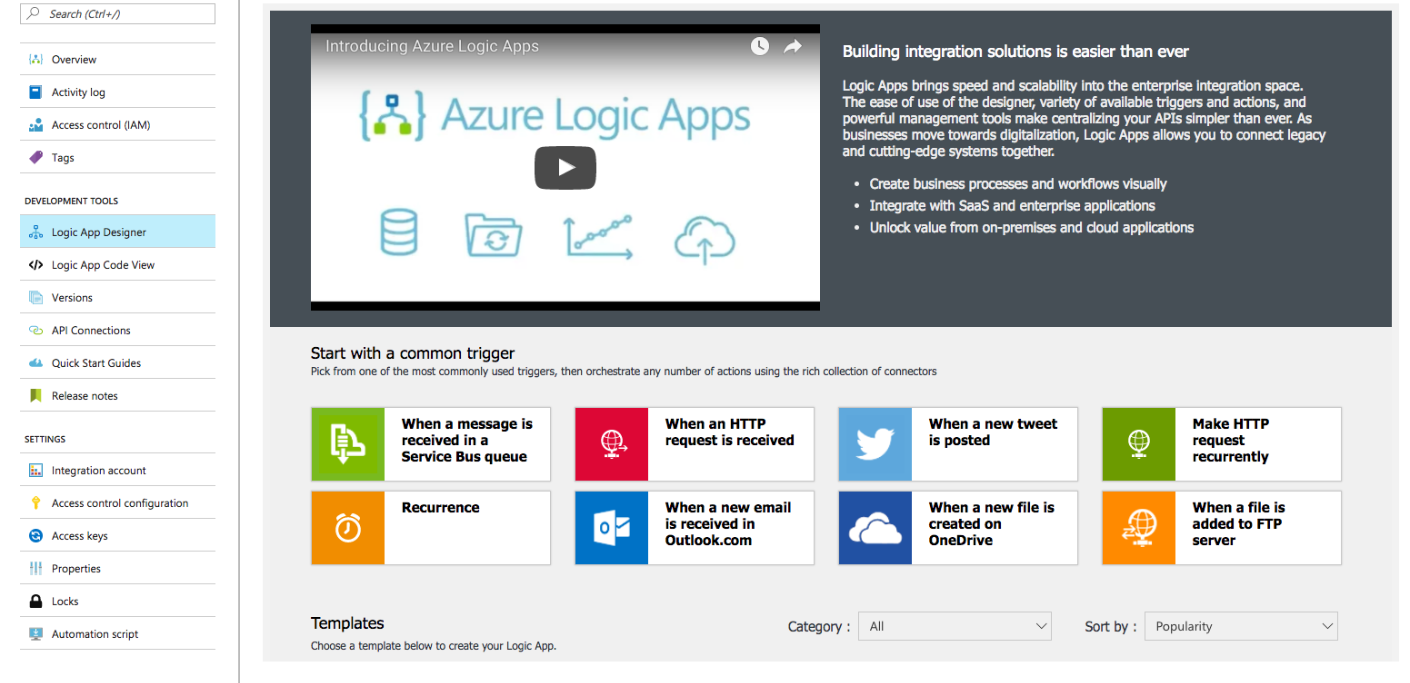
- Scroll until you see the "Blank Logic App" template, and select it.
- You will be prompted to select a trigger and service, click the "See More Options" under services.
-
Find the HTTP within the services, and click that button.
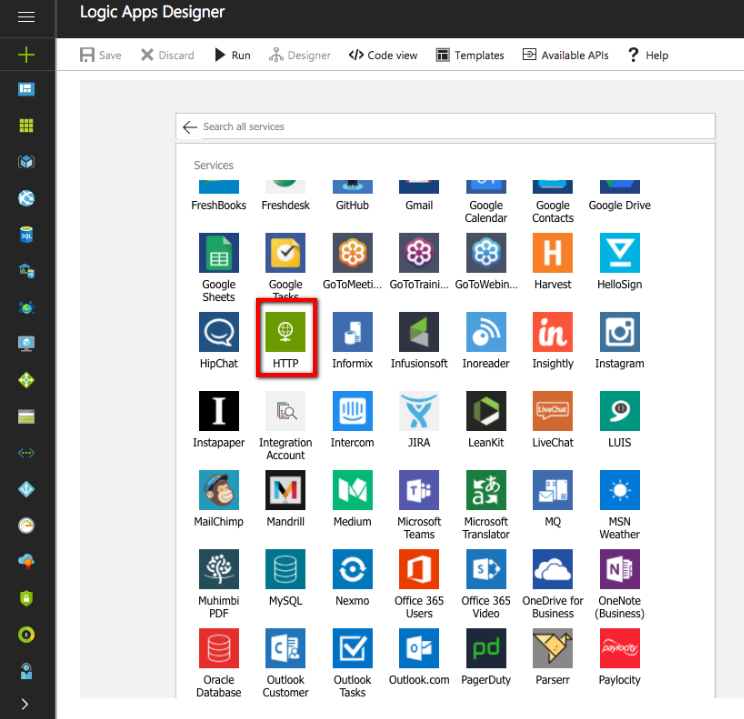
- There will be three trigger options, and select the "HTTP trigger" at the top.


We can move on to configuring the probe. For the Method, select "GET." For URL, enter the endpoint that you will be probing. If you're monitoring an entire website, you should select your site root. It can look like this: HTTP://www.yourdomain.com. Set the "Frequency to Minutes," and change the interval to "quarter-hour (15)."
This has created an HTTP GET request for the root domain, which will occur every 15 minutes.
At this point, you should start to tell the Logic App what to do when the probe occurs. To do this, you have to click on the "New Step" button below the probe, and click "Add a Condition."
- For the first box, click the predefined "Status Code" file from the "Insert Parameters From Previous Steps."
- For the second box, the pull-down menu, select "GreaterThan Or Equal To"
- For the third, enter "400."

This will tell the Logic App that a successful probe is defined as any request that will come back from the webserver, as a 5xx or 4xx status code.
Because we set the condition as "Yes" for the 4xx/5xx error, we have to leave the "If No, Do Nothing" action steps vacant. But under "If Yes, Do Nothing," select the "Add An Action" option.
A list of various services and actions will appear, scroll until you see the "Gmail - Send Email" option and click on it. You will have to sign-in to your account for Logic App to authorize access to the account. Click on your account, and grant permission.

You will now be able to configure the message that will be sent via Gmail.
Fill out the form as follows:
- To: type the recipient email address.
- Attachments Content: Select "Body" from "Insert Parameters From Previous Steps."
- Attachments Content: Type "enter text/html".
- Attachments Name: Type "response.html".
- Body: Type message, including the status code from "Insert Parameters From Previous Steps."
- Subject: Enter the subject line, include the code from "Insert Parameters From Previous Steps."
Now the Gmail action has been set up, and all you have to do is save and monitor the workflow.
Save and Test Workflow
Even though the action has been completed, the workflow has to be saved. To do this, scroll to the top of the workflow, and click the "Save" button.
Simple, right? Now the workflow will execute every 15 minutes until you stop it or delete it. After clicking save, you will be navigated to the Logic App overview, which will have an execution log.
Check back in an hour, and click on the log entry to see a graph representation of how the workflow has been executed, and what sort of result it had received.
Because the workflow has been developed to trigger in the response to a non-OK result from the HTTP probe, you can test it by editing the condition to invoke the workflow from a 1xxx/2xx/3xx response.
Go back to the setting blade on the left, and click the "Logic App Designer" button. Open the condition panel, and change "Is Greater Than Or Equal To" to "Is Less Than."
Save it, and click "Run."
After a moment, the actions will be executed. Make sure to revert the changes, so that you don't leave them as they are.
If the test was a success, you will receive an email with the information you input in the form prior.
Conclusion
Even though this is a simple approach to website monitoring, Logic Apps is significantly more powerful. You can also integrate your custom connectors via Web APIS, or use third-party services, such as MailChimp, Facebook, Github, Zendesk, Dropbox, Salesforce, and many more.
Logic Apps is developed as a fully scriptable JSON, which means you can develop them into your stacks, and deployment pipelines, therefore they can be used with SDLC tooling.
Logic Apps do come at a cost, and that's on a per execution basis. The first 250,000 executions are priced at .0008 cents each, so that's quite affordable for small-scale operations. With the rate of execution set for this guide, the monitoring will cost you about $0.67 per month.