Log aggregation and analysis is a huge field, with entire product stacks being built around it to make it easier. AWS's CloudWatch service collects usage metrics automatically, but it can also be configured to aggregate logs from your EC2 instances.
Why Aggregate Logs in The First Place?
Say you're running a web server like nginx. Every time someone connects to your website, a new line in a log file is created containing details about the visit. This info can be quite useful; for example, nginx records the following data for each request:
- IP Address of the connecting user
- Username, if using basic authentication (blank most of the time)
- Time of the request
-
The request itself (for example, "
GET /index.php?url=abc - Status code returned
- Bytes sent, excluding HTTP headers (useful for tracking the actual size of traffic)
- HTTP referer (that is, the site the user came from)
- User agent of the user's browser
While an analytics suite like Google Analytics provides a lot of this info, too, log files are created automatically and update in real time. If you wanted to know how much traffic you're receiving from a particular IP range, or what your biggest sources of referral are, querying your log files can return results very quickly. (Elasticsearch is good for this; AWS offers it as a managed service that works well with CloudWatch Logs.)
Now, say you have a lot of web servers---suddenly the problem becomes a bit more complicated than just searching a single log file. Even with only two servers, you won't get accurate results unless the logs are aggregated in one place. This is where CloudWatch's Log streaming feature comes in handy.
How to Set Up CloudWatch Logs
To get an EC2 instance hooked up to CloudWatch Logs, you need to install the logs agent that handles sending the logs to CloudWatchFirst, and you need to configure a new IAM role for the agent to operate as.
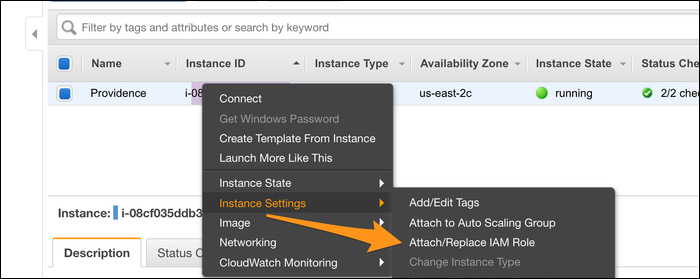
This role must be associated with your instance, so from the EC2 Management Console right click your instance and choose "Instance Settings" > "Attach/Replace IAM Role":
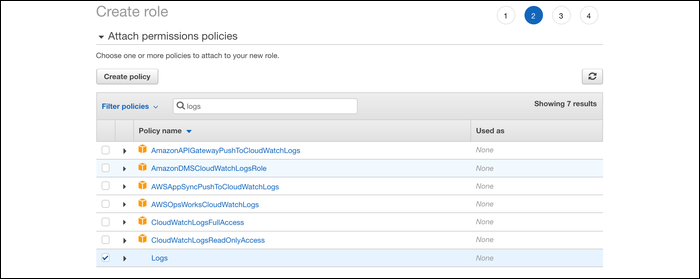
If this is your first time doing this, choose to create a new role at the IAM Console. Create a new role, then choose "EC2" as the service that uses the role.
Next, add permissions to the role. Create a new permission and paste in the following JSON:
{

             "Version": "2012-10-17",

             "Statement": [

             {

             "Effect": "Allow",

             "Action": [

             "logs:CreateLogGroup",

             "logs:CreateLogStream",

             "logs:PutLogEvents",

             "logs:DescribeLogStreams"

             ],

             "Resource": [

             "arn:aws:logs:*:*:*"

             ]

             }

             ]

            }
Once that's done, head back over to the role creation tab and select the newly created permission.
Give the role a name, and you should be good to go. Head back over to the EC2 console and hit refresh on the role dropdown. You should see the logs agent role.
Once permissions are out of the way, you can install the agent. If you're on Amazon Linux, choose the package available on yum:
sudo yum install -y awslogs
If you're on Debian/Ubuntu, you have to download the installer instead:
curl https://s3.amazonaws.com//aws-cloudwatch/downloads/latest/awslogs-agent-setup.py -O
Next, run the installer, specifying the region:
sudo python ./awslogs-agent-setup.py --region us-east-1
Here, you configure which log files the log agent processes. By default, it sends /var/log/syslog, which logs a lot of system actions. You can add multiple log files here. Each log file is aggregated into a group (the name of which is defaulted to the log location), and is given a timestamp.
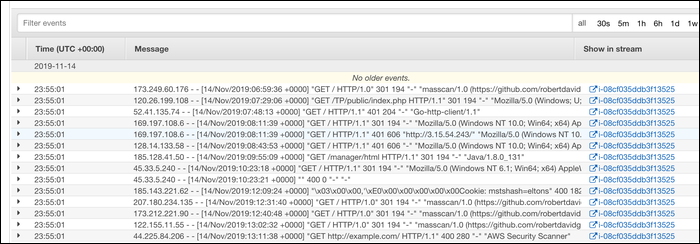
Logs from individual instances are separated by instance ID, but you're able to view a total stream for each log group comprised of all instances sending logs to that group. Once you configure the agent, logs begin to show up in CloudWatch immediately (give or take about five seconds).
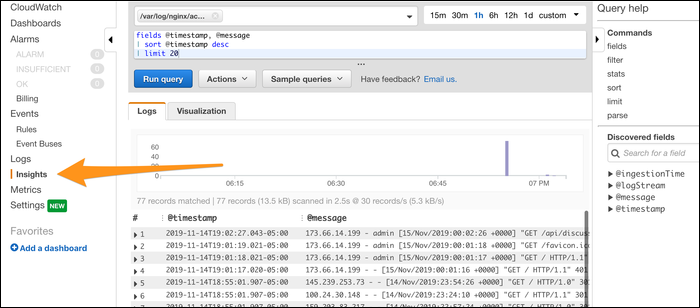
From here, you can use the search bar in the log viewer to perform simple searches, and use CloudWatch's built in Insights tool to query your logs.
If you want more searching power, or want to visualize things with Kibana, you can use AWS's hosted Elasticsearch service, which integrates well with CloudWatch Logs.

