Quick Links
Monitoring your cloud resources lets you stay ahead of demanding workloads. DigitalOcean's droplets benefit from versatile built-in reporting options that give you visibility into your usage.
Graphing Droplet Metrics
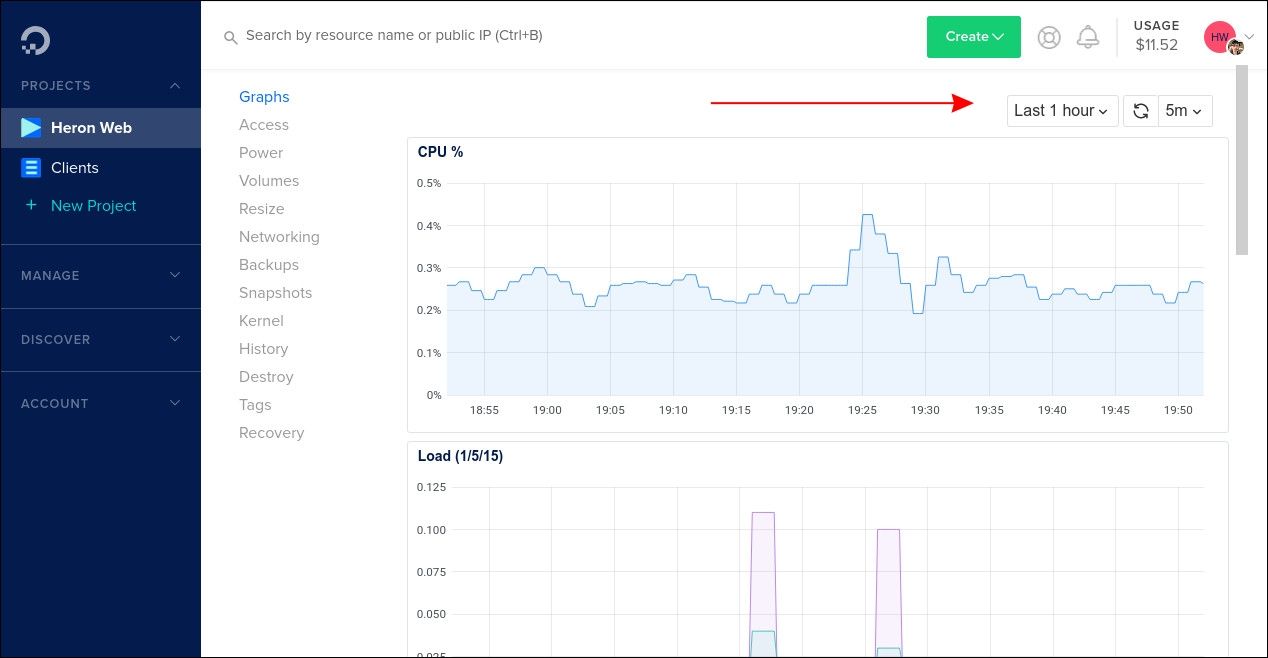
The most straightforward way to monitor your droplets is with the graphs in the Cloud Control Panel. Log in to your DigitalOcean account and click one of your droplets. You'll end up on the Graphs screen.
The graphs give you an at-a-glance view of your droplet's CPU, RAM, and disk and network utilization. Using the dropdowns at the top right, you can adjust the timeframe on display and set an automatic refresh interval. Data is available from the past hour through the past 14 days.
How Are Metrics Collected?
The metrics are collected from your droplet using DigitalOcean's open-source do-agent utility. This is supported on Ubuntu, CentOS, Debian, and Fedora. Other distributions (as well as older versions of the above) can't use
do-agent,
and display a limited set of basic graphs instead.
You can manually install do-agent if your droplet's running a supported distribution, but you don't see the full complement of graphs. This might be because you upgraded your droplet from an older version, or perhaps you originally created it without the metrics agent installed.
Connect to your droplet over SSH and run the following installation script:
curl -sSL https://repos.insights.digitalocean.com/install.sh | sudo bash
Data should start to appear in your Cloud Control Panel within a few minutes.
do-agent periodically collects data from the /proc virtual filesystem. The metrics are then uploaded via gRPC to DigitalOcean's ingest endpoint. The agent authenticates itself as belonging to your droplet, so the data ends up in your DigitalOcean account.
None of the information provided by do-agent is security-sensitive. The tool only transmits data and does not receive it. Although it communicates over ports 80 and 443, you can safely run a web server while it is installed.
More in-Depth Monitoring With Linux Tools
DigitalOcean's graphs give you an at-a-glance view of your droplet. You'll need to connect over SSH and use Linux tools to delve deeper into spikes in activity.
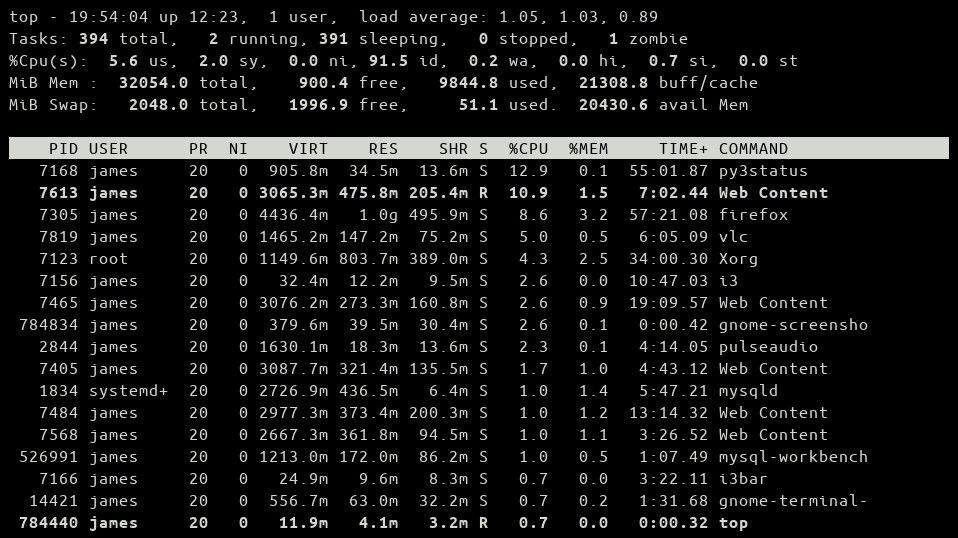
You can use top to quickly view the processes running on your droplet. The table is automatically updated. It's sorted by CPU usage by default. To switch to sorting by memory consumption, press Shift+M. You can switch between memory units (bytes/MB/GB) by pressing the e key. The units of the stats at the top of the screen are toggled using Shift+E.
Another useful monitoring command is uptime. This shows you how long your droplet has been running, how many user connections have been made in that time, and the load average figures over the past one, five, and 15 minutes.
Load average is a measure of the number of running and waiting processes over a period of time. It indicates the availability of your system to handle new processes. A low load average suggests that your droplet is generally idling, which you could verify by looking at DigitalOcean's CPU graph. The maximum load average value is equivalent to the number of cores available to your server (i.e. 4.0 on a droplet with 4 vCPUs).
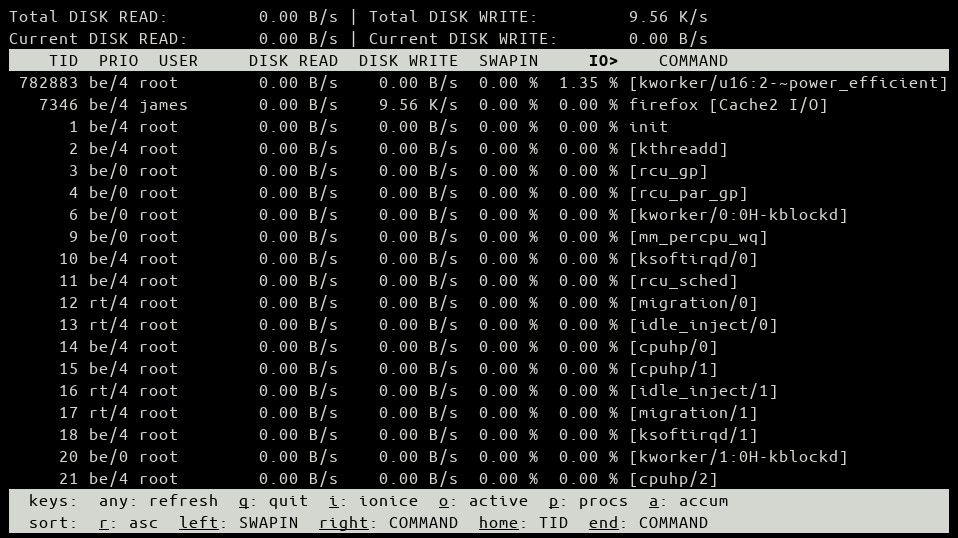
Information on disk utilization can be obtained from iotop. This will show you real-time disk read-and-write stats. It includes a list of the processes that are using your disk. The IO column indicates the percentage of time that each process spent waiting on disk I/O.
Creating Automated Alert Policies
You can opt-in to receive alerts when metrics exceed a specific threshold. Alerts can be sent over email or via Slack.
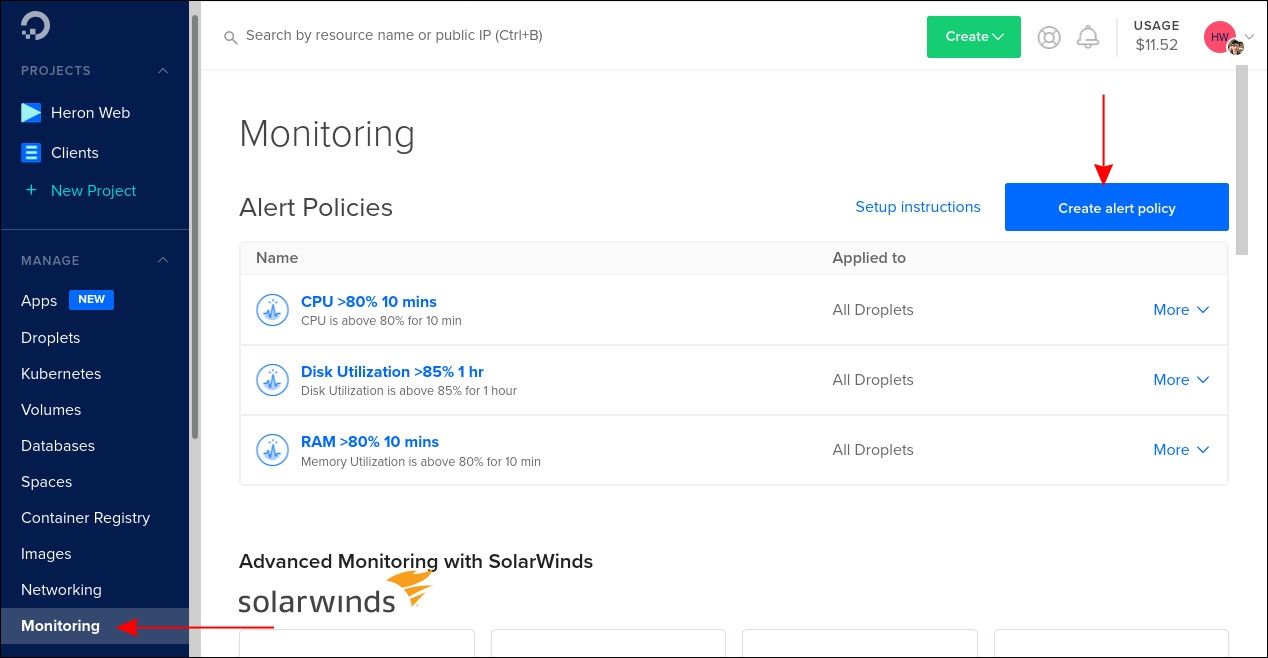
Click the "Monitoring" link in the Control Panel sidebar. You'll see a list of the alerts in your account. Click the blue "Create alert policy" button to add a new policy.
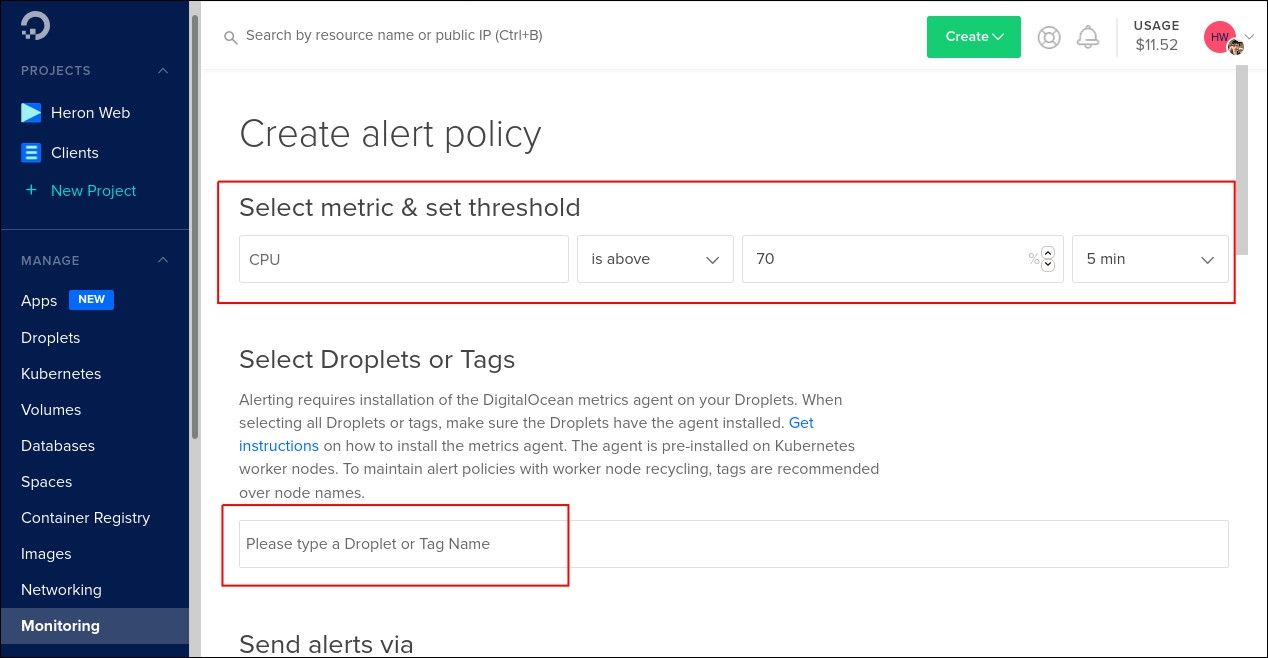
Use the dropdowns to configure your new alert. The available metrics align with the data collected by do-agent. You can choose between five-, ten-, 30-, and 60-minute reporting thresholds. The example shown below would send you an alert if the CPU usage exceeded 70% for more than five minutes. The aggregate reporting prevents momentary spikes and troughs from creating a slew of alerts.
Next, choose the droplets to apply your policy to. You can add individual droplets, a tag name (for Kubernetes nodes), or the special "All Droplets" selector.
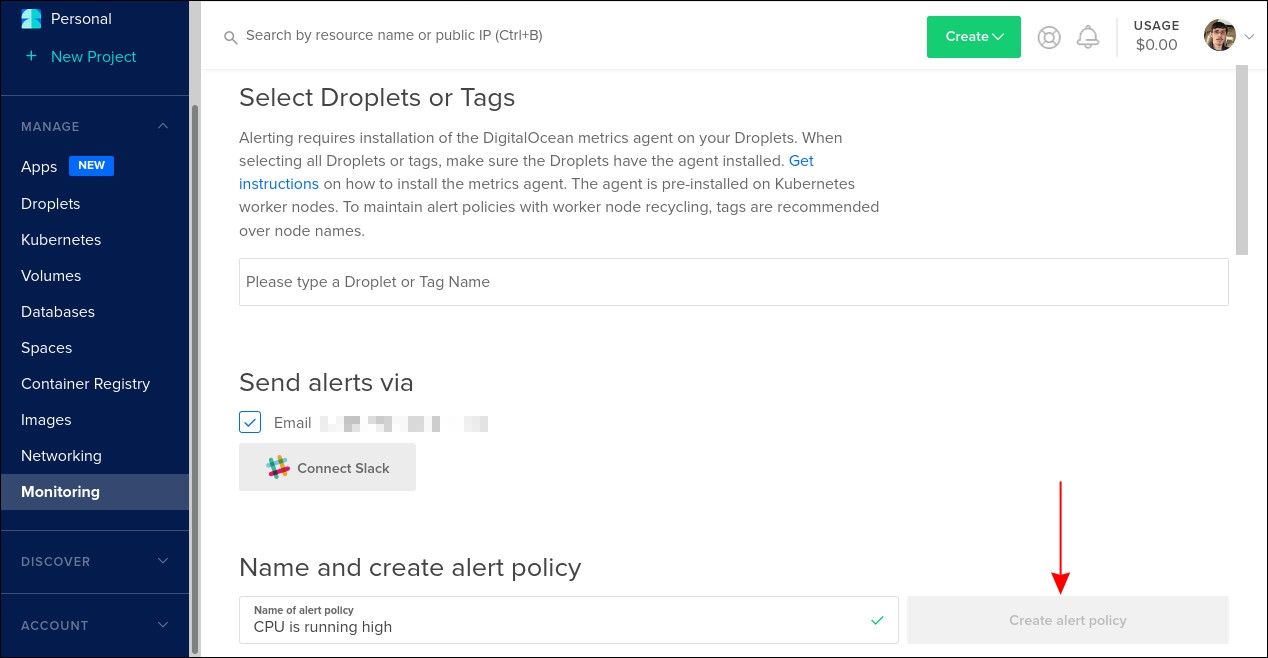
Under "Send alerts via," configure the alerting mechanism. This is prefilled with the email address associated with your DigitalOcean account. You can add additional recipients if needed, which is useful if you'd prefer a co-worker or contractor to handle incidents.
You can opt to receive alerts in Slack. Click the "Connect Slack" button and follow the prompts to log in to your Slack account. Authorize DigitalOcean to access your Slack workspace. You'll then be able to choose whether alerts are posted to a channel or to a user's direct messages.
To activate your alert, give it a name and press the "Create alert policy" button. You'll need to repeat the process and add another alert if you want to track more metrics. There's currently no support for adding multiple metrics to a single alert policy.
Limitations of DigitalOcean's Monitoring
DigitalOcean's monitoring options give you a high-level view of your droplet's performance. The data is accurate and timely but only shows you what's happening, not why.
Configuring a DigitalOcean alert policy ensures that you're made aware of problematic events as they arise. Nonetheless, the system can't be used as your sole monitoring solution. You'll need to make sure that you're prepared, with tools and workflows that can expose the root cause of anomalous activity.
DigitalOcean's monitoring focuses on the system health of your droplet. In an ideal scenario, it should be rare that an alert triggers. Your application-level monitoring system should begin reporting increased error rates or throughput bottlenecks before they impact the wider system. However, in many teams, incident response still starts from the top-down, in which case, DigitalOcean's Graphs and Alerts are an immediate tool to help inform firefighting.
Conclusion
DigitalOcean's monitoring options let you visualize resource usage and stay ahead of changing requirements. Beyond droplets, the Control Panel also offers activity graphs of Managed Databases, Kubernetes Clusters, and Load Balancers. Select any of these resources from its respective Control Panel page to assess activity in real-time. Alongside droplet compute stats, these metrics give you insights into the pressures your workloads are facing.

