Quick Links
The Kubernetes Dashboard is an official application that lets you inspect and edit your resources via a web-based graphical interface. Deploying a Dashboard instance into your cluster lets you visualize activity without running sequences of complex terminal commands.
Installing the Dashboard
Self-managed Kubernetes installations don't come with the dashboard included by default. You need to use kubectl apply with the dashboard's publicly hosted manifest file to deploy an instance inside your cluster:
kubectl apply -f https://raw.githubusercontent.com/kubernetes/dashboard/v2.3.1/aio/deploy/recommended.yaml
This will setup the dashboard with the recommended default settings.
Accessing the Dashboard
The baseline installation doesn't expose the dashboard publicly, helping maintain cluster security. You can get access by using kubectl proxy to map host port 8001 to your cluster:
kubectl proxy
You should now be able to load the dashboard in your browser by visiting this URL:
http://localhost:8001/api/v1/namespaces/kubernetes-dashboard/services/https:kubernetes-dashboard:/proxy/
The request to localhost:8001 will be handled by the Kubectl proxy and forwarded to your cluster. The cluster will respond with the dashboard UI.
Publicly Exposing the Dashboard
You can publicly expose the dashboard if you need direct HTTP access from devices where kubectl isn't available. Use kubectl to edit the dashboard's service resource:
kubectl --namespace kubernetes-dashboard edit service kubernetes-dashboard
This will open the resource's YAML manifest in your default text editor. Find the line with type: ClusterIP and change it to type:NodePort. Save and close the file. The alteration will be applied to your cluster.
Next use Kubectl to check the port that's been assigned:
kubectl --namespace kubernetes-dashboard get service kubernetes-dashboard
NAME TYPE CLUSTER-IP PORT(S) AGE

            kubernetes-dashboard NodePort 10.100.110.101 443:31730/TCP 1m
In this example, the dashboard's been given port 31730. You can now access the web interface by accessing that port on your cluster's public IP address.
Using the Dashboard With Managed Clusters
Many managed Kubernetes providers either enable the dashboard by default or provide a one-click installation method. When such an option's available, it's easiest to use it instead of manually installing and maintaining the app.
MicroK8s users can add the built-in dashboard plugin to activate the dashboard with a single command. The dashboard will be bound to the cluster's ClusterIP by default.
Exploring the Dashboard
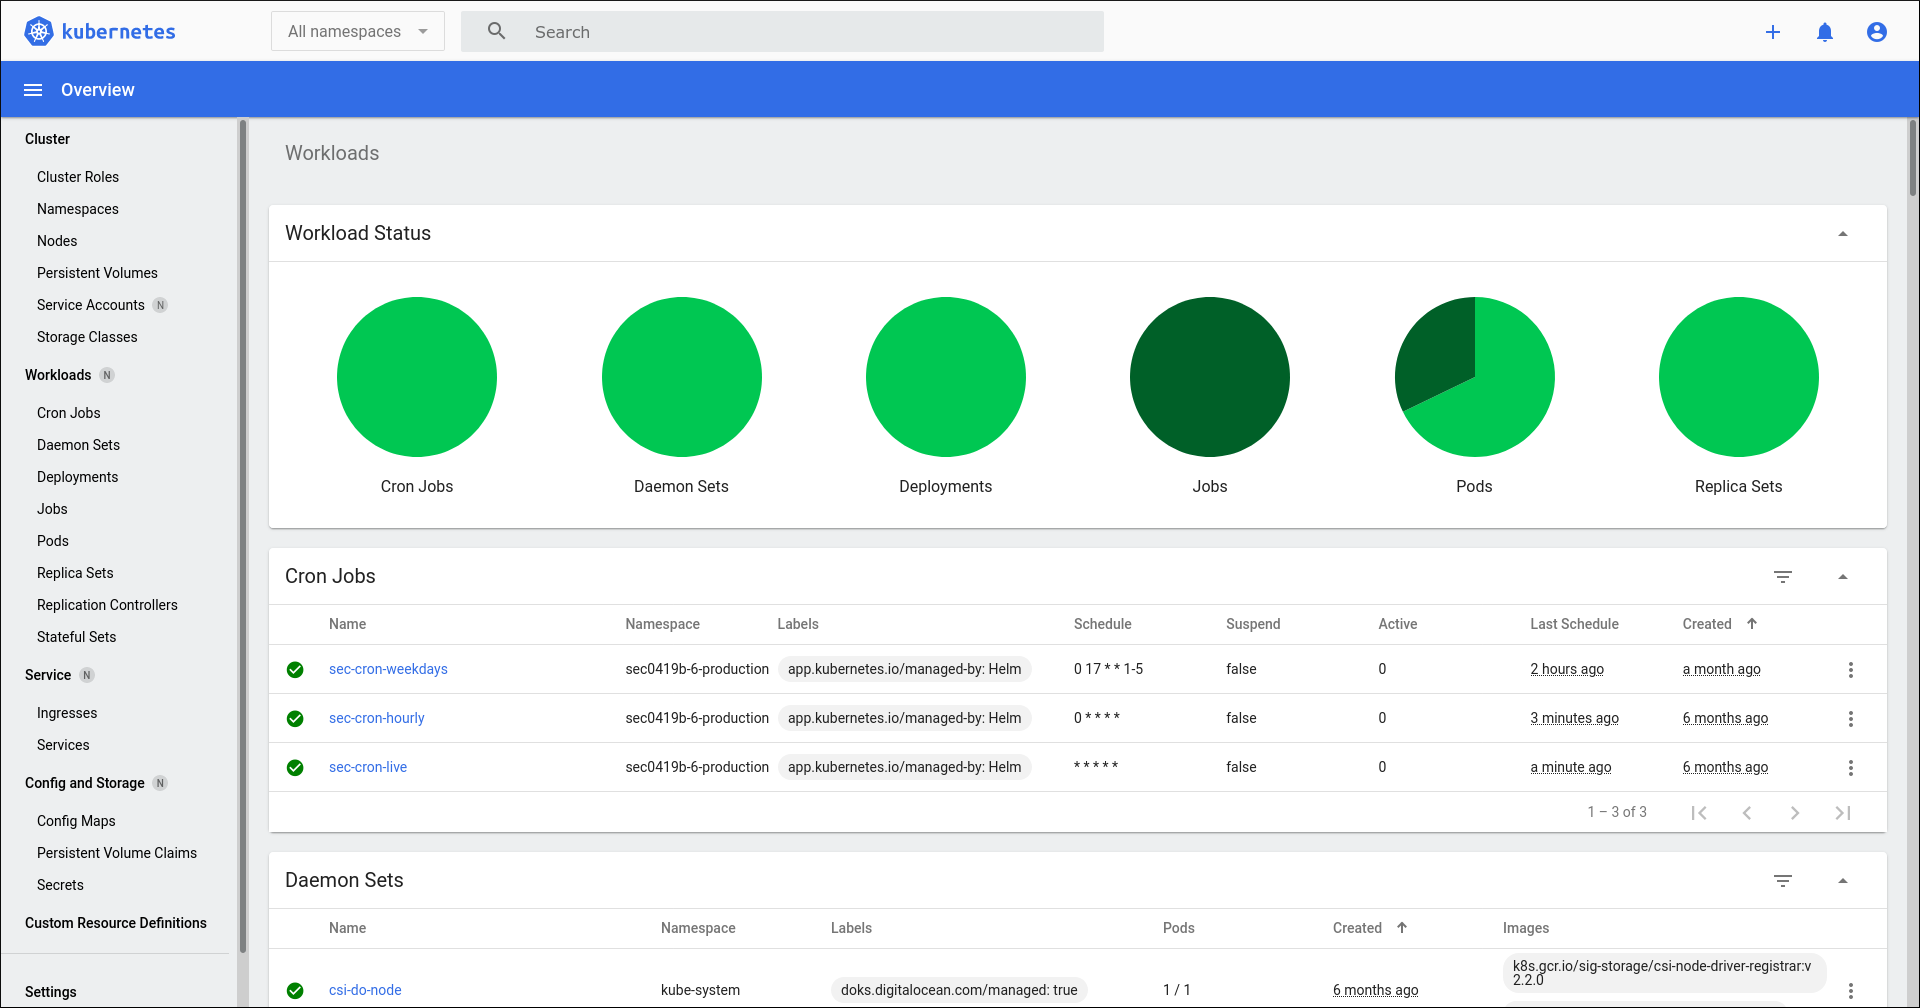
The Dashboard home screen displays an overview of the activity in your cluster. Colored pie charts at the top give you an at-a-glance view into the health of your resources. These let you quickly visualize whether any action's required:
- Bright green - These are healthy active resources such as running Pods.
- Dark green - These are healthy but stopped resources, including inactive Pods and scheduled Cron Jobs that have completed and terminated.
- Yellow - Slices of yellow indicate you've got resources in a transient state, such as a Pod that's starting up and waiting for its container image to be pulled.
- Red - A red pie slice means there's a failed resource that stopped due to an error.
Below the pie charts, tables display a breakdown for each resource type in your cluster. Scroll down to view Cron Jobs, Deployments, Pods, Replica Sets, Services, Volumes, and other built-in resources.
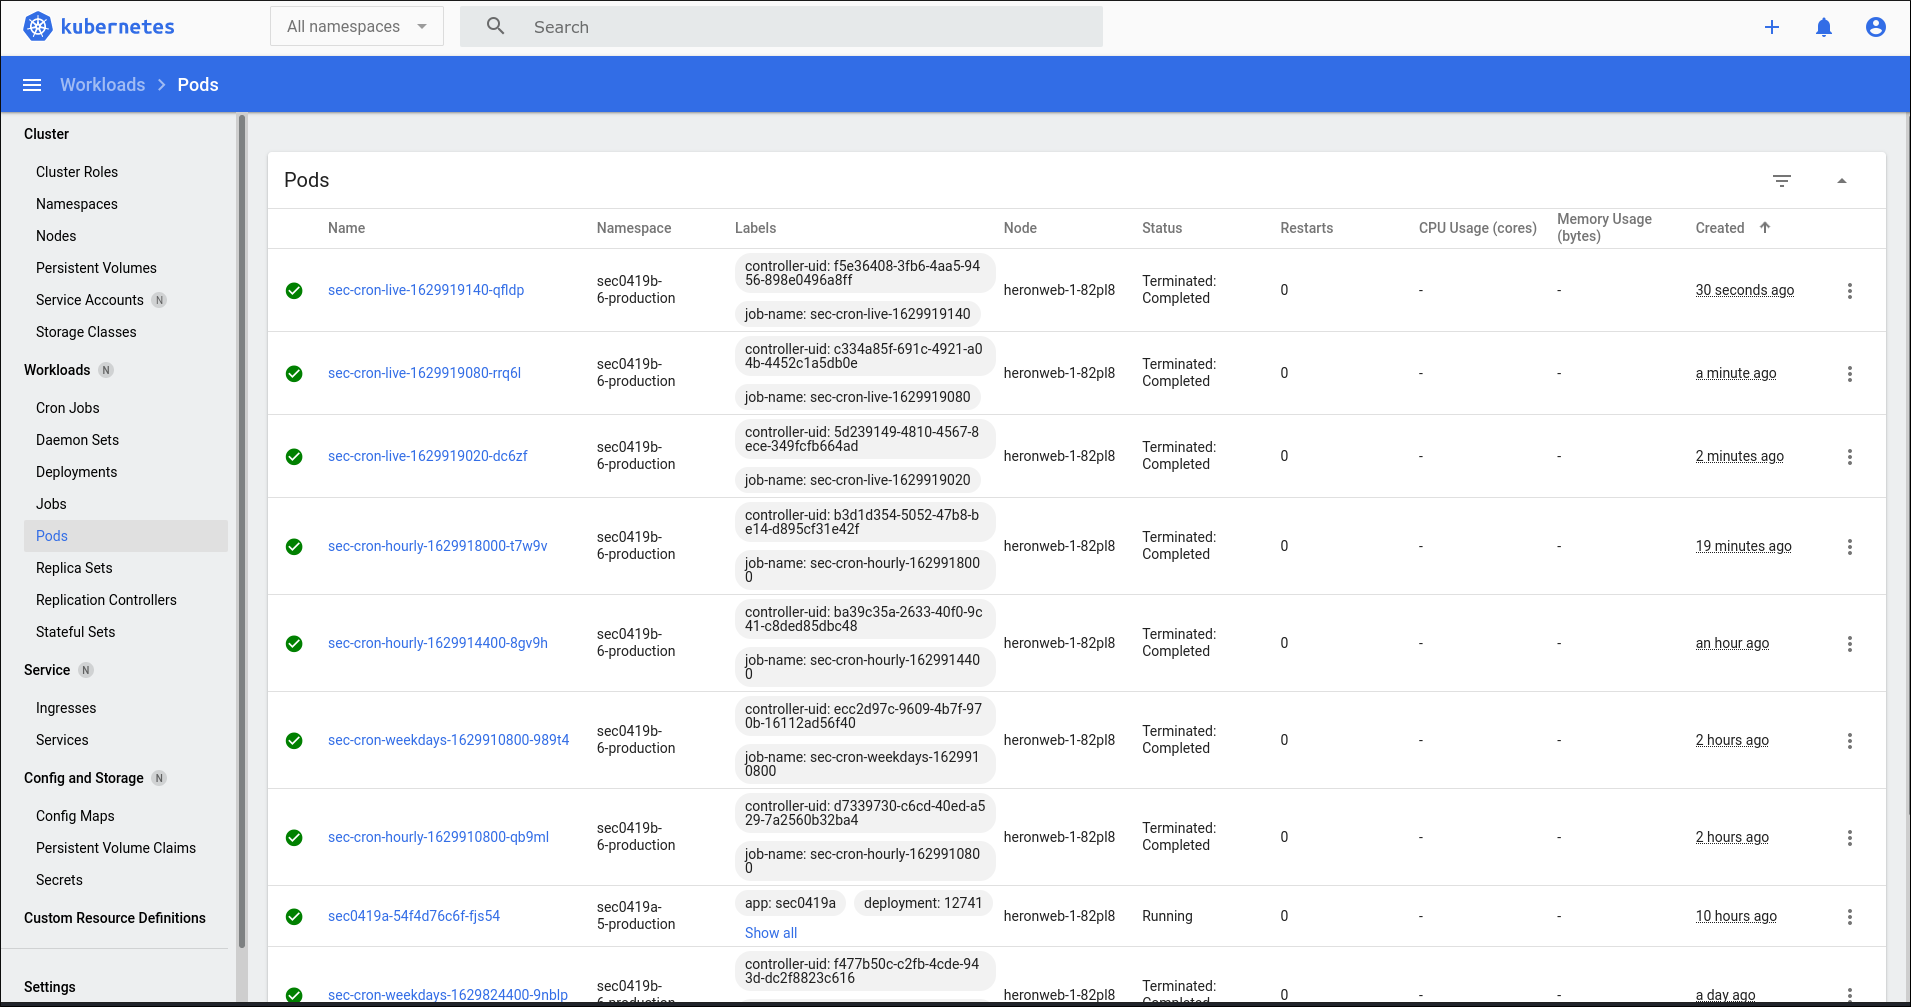
You can jump to a specific section using the left sidebar. Clicking a resource type will display its table on a dedicated screen, letting you focus in on the information you need.
Selecting a Namespace
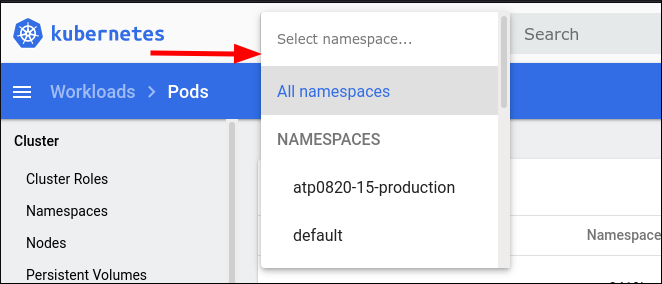
The dashboard defaults to showing all matching resources in your cluster. Use the dropdown in the top-left to scope the results to a specific namespace, letting you exclude system components. The filter applies to all screens until you change it again.
Another way of restricting what you see is to use the search bar at the top of the screen. This lets you find matching resources across all resource types, displaying a results screen using the same multi-table format as the home screen.
Creating Resources
Click the "+" button in the top-right to create a new resource. This lets you upload or paste a kubectl-compatible Kubernetes manifest file. The effect is the same as running kubectl apply.
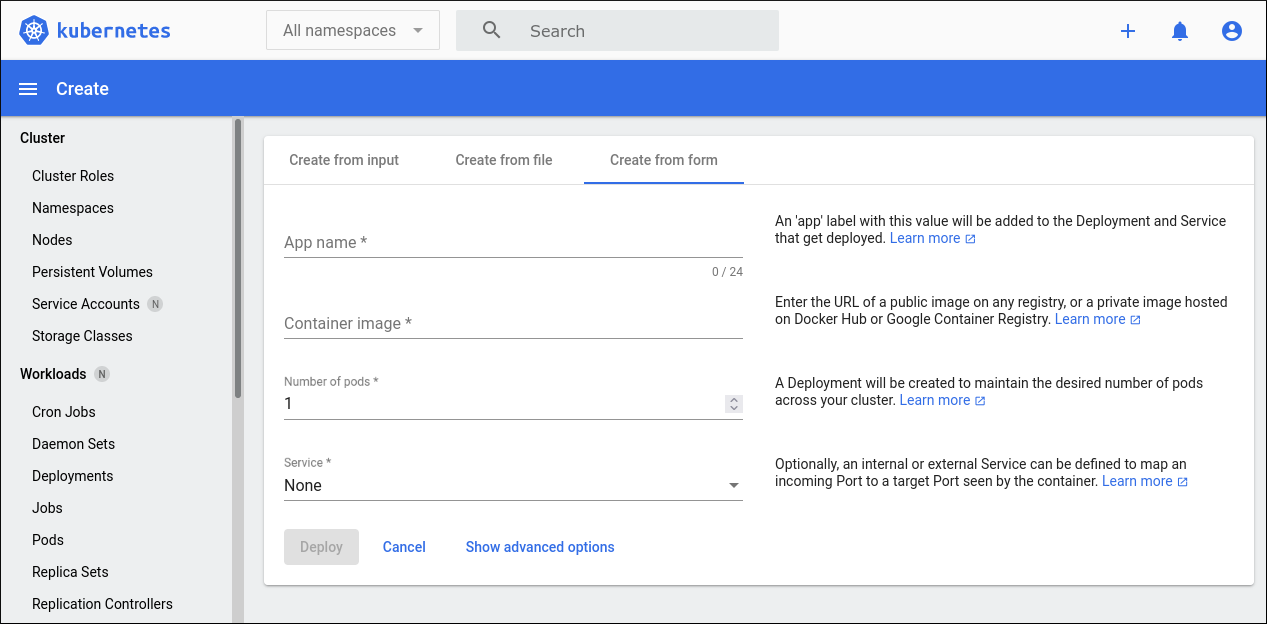
There's also a basic implementation of a form-based deployment creator. Click the "Create from form" tab, then fill out the fields to launch a new set of Pods into your cluster.
- App name - Supply a name for your new deployment.
- Container image - The Docker image to pull for your new containers. This must be accessible to your cluster.
- Number of pods - Specify the initial number of Pods to create. Kubernetes will ensure there's this many active container replicas, helping guarantee availability.
- Service - This field lets you expose your containers via an internal or external service. Choosing "internal" will only allow access from within your cluster. Select the service type, then fill out the port to accept traffic from and the container port to map to.
Pressing "Show advanced options" displays several more fields that let you setup labels, environment variables, CPU and memory constraints, and an optional image pull secret. The latter accepts a docker.json configuration snippet providing credentials for the Docker registry you're pulling from.
Click the "Deploy" button to begin the deployment into your cluster. Manually edit the created resources afterwards if you need more options than the form provides.
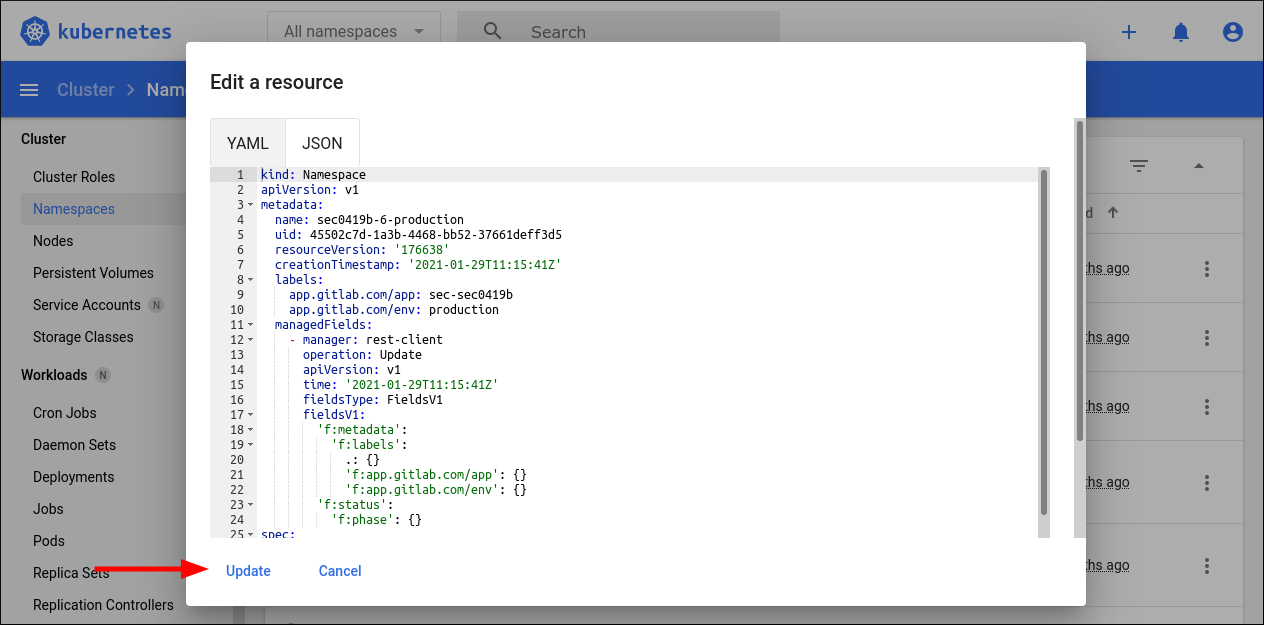
Resources are edited by clicking the three dots icon on the right side of any table row. Choose "Edit" from the menu to launch a popup with the YAML representation of the resource's current manifest. Make the changes you need, then press "Update" to apply your alterations. It's the same as running kubectl apply in your terminal.
Monitoring Node Resource Usage
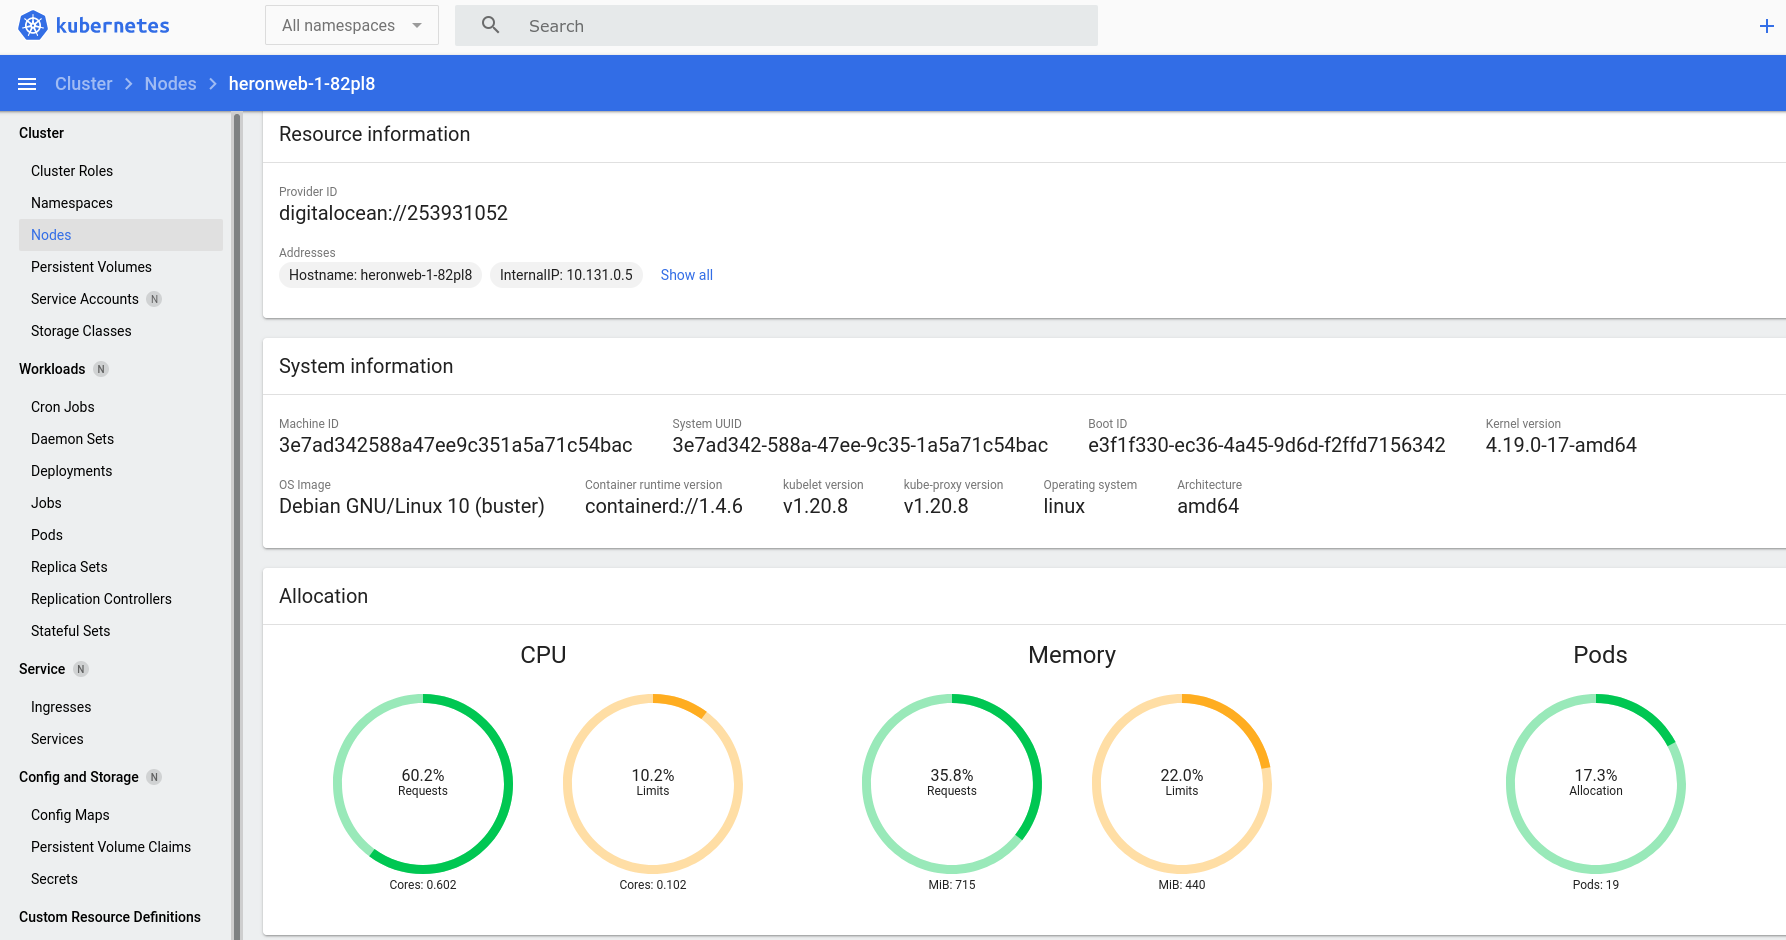
The dashboard provides a visualization of node resource consumption. Click the "Nodes" item in the left sidebar, then select a Node from the table. The next screen provides detailed information about the node, including its operating system, Kubelet version, and internal IP address.
Scroll down the page to see graphs of CPU and memory consumption. The "Pods" graph lets you see how many Pods could be scheduled to the Node based on its current allocation. Further down the page, the "Pods" table enumerates all the Pods that are already running on the Node.
Viewing Pod Logs
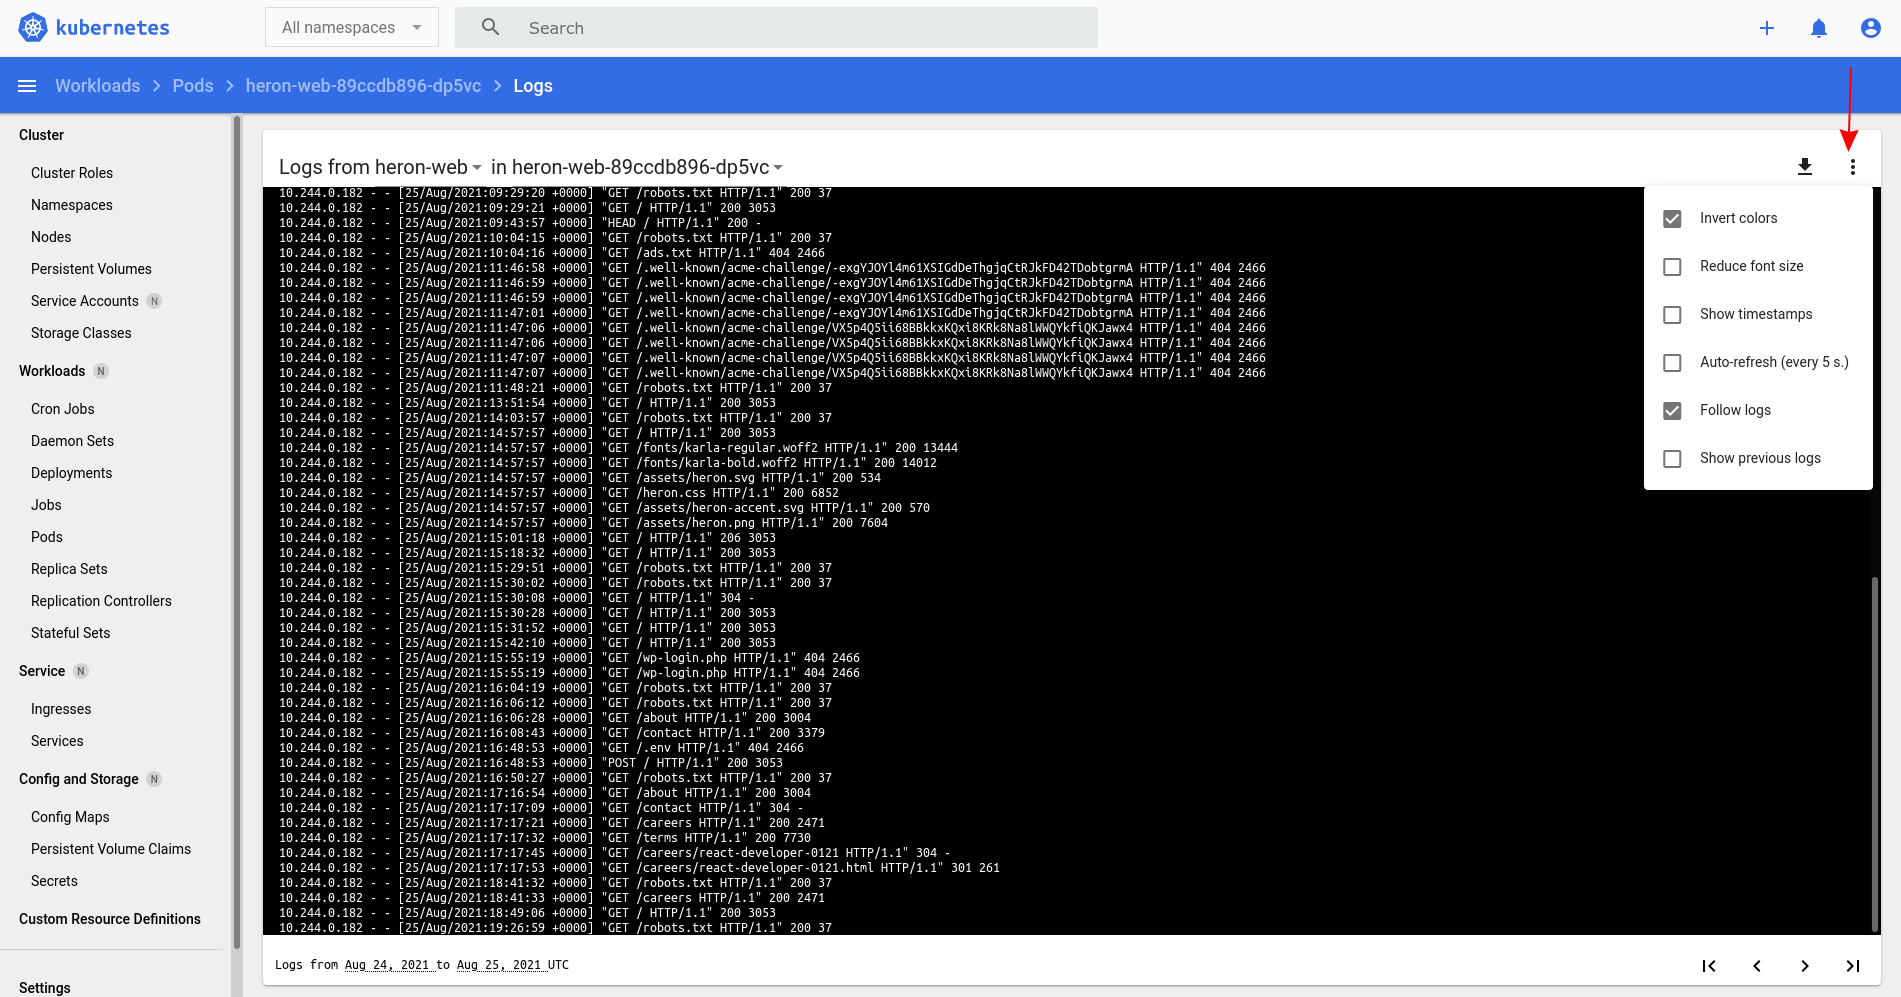
A common use of the dashboard is monitoring live log output of Pods and Jobs. Find the item you need to inspect in one of the dashboard's resource tables. Click the right-most three dots icon, then select the "Logs" item from the menu.
Click the three dots icon in the top-right of the log viewer to activate automatic refresh. Checking the "auto-refresh (every 5s)" option lets you stream logs continually. Changing the refresh interval is discussed below.
The other menu options let you customize the log display by reducing the font size, choosing a color mode, and selecting whether timestamps are displayed. Activating the latter option is useful when the container log output doesn't include its own timestamps.
Dashboard Settings
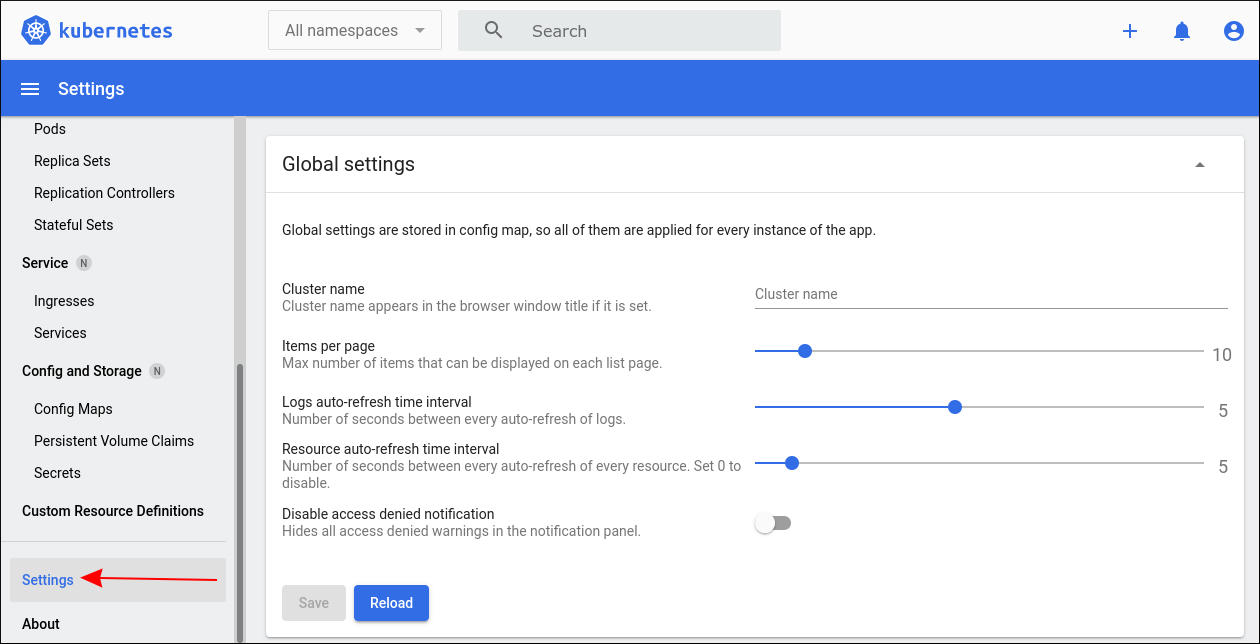
The app comes with a handful of global settings that let you tweak its responsiveness. These are found via the "Settings" link at the bottom of the left sidebar.
Drag the sliders to adjust the auto-refresh intervals for the log viewer and resource tables. Reducing these values gives you a live view of data but could reduce performance on slow network connections.
You can also change the number of items displayed on each table page. Increase the "items per page" if you're tired of clicking through pages each time you view your resources.
Summary
The Kubernetes Dashboard is a useful add-on which lets you monitor your cluster's activity from your web browser. It can also cater for basic resource editing requirements but you'll still need to work with manifest text files most of the time. The resource creation form is only suitable for the most basic of use cases and doesn't work at all with existing items.
Enabling the dashboard is optional and won't necessarily be useful in all scenarios. If you're comfortable with the terminal, concerned about security, or trying to minimize background resource consumption, you won't be losing anything by sticking with familiar CLI tools.
Deploying the Dashboard should be a straightforward procedure when you need it, whether you're looking for remote monitoring or an easier way of monitoring multiple clusters without juggling Kubectl contexts.

