Managing a network of Linux servers used to require using a terminal emulator to ssh into each of your servers. To update a local firewall rule, system administrators had to learn arcane
iptables
commands to add the right incoming and outgoing ports. To add a new local user required running
useradd
with the necessary options. And to check free space on the local filesystems, Linux administrators likely ran
df
and
du
commands on each storage system.
Linux server administration would be much easier with a point-and-click interface that did all the hard work for you behind the scenes, so you could focus on your job: managing servers. That's where Cockpit comes in.
Cockpit provides a web-based dashboard so you can monitor and update your Linux systems. I find with Cockpit, remote server management is a breeze. Let's take a look at what Cockpit has to offer:
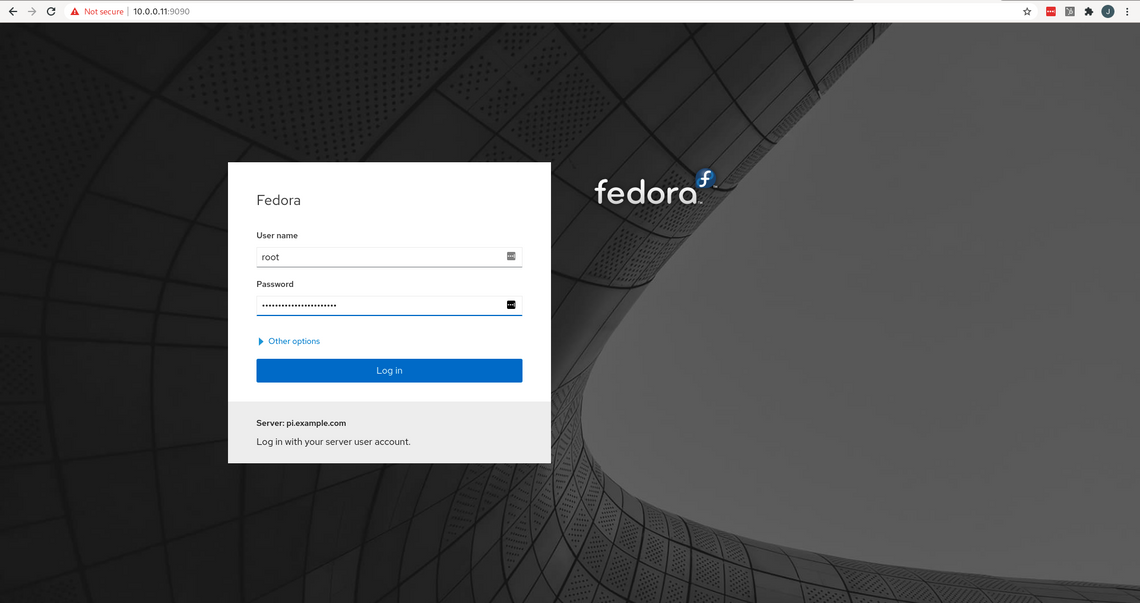
To access Cockpit on your server, point your web browser to your server's IP address on port 9090. For the Raspberry Pi mini-server I run at home, that's
10.0.0.11:9090
. But your network will likely be different; use your Linux server's hostname or IP address in your web browser's URL line, and add
:9090
to connect to port 9090. Login with the root username and password for that server.

After you've logged in, Cockpit displays a system overview screen. This lets you check your server status at a glance: CPU and memory usage, server information, configuration overview, and overall server health. You can see on my Linux system that things are running fine, but I have a few new patches to install.
The system overview also makes it easy to shutdown or reboot the server, such as for system maintenance. The overview also provides a great jumping-off point for more complex tasks. If you need to join your server to a domain, or need more details, you can click the blue links.

The left side of the Cockpit dashboard shows a navigation menu. Click each one to check logs, storage, and networking, to update accounts, to stop and start services, or to apply updates.
Checking logs is straightforward in the "Logs" tab. No more wading through your
/var/log
directory, trying to spot errors or warnings. Cockpit shows the log entries with a helpful icon to indicate errors or warnings. Click on the menus at the top of the screen to filter logs by time, priority, or identifier. The default shows everything at "Error" and above.
If you need more information about a particular log message, you can click it for details. For example, I run my Raspberry Pi as a print server, and the logs showed that my printer was turned off when I was trying to print.

The "Storage" tab presents your filesystems and storage I/O at a glance. You can also add other storage, including remote NFS filesystems, from this panel.
My Raspberry Pi server has an internal micro SD card for its main storage, and a USB fob drive mounted at
/backup
so I can make backups. On the "Storage" tab, I can quickly see my disk usage to verify my backup filesystem is about half full, and my main storage is mostly empty.

The "Networking" tab lets me check the network on one screen. My Raspberry Pi runs only on my wireless network at home, so only my
wlan0
network device shows any traffic.

Managing your firewall is also much simpler. Click the "Edit rules and zones" button to enter a panel that lets you add or remove services from the firewall. No more debugging a list of
iptables
commands to update your firewall rules, now adding and removing services from the firewall is just clicking a button and scrolling through a list of services. Tick the box next to the services, you want to add, and click the "Add services" button.

If you need to manage local accounts, you can do that from the "Accounts" tab. You can quickly create new users with the "Create new account" button, or click on a username to edit the account details. You can even add and remove SSH keys to support passwordless login.

The "Services" tab lets you start and stop services. Click on each service, and you'll find a toggle to enable or disable a service at boot-time, or to immediately reload, restart, or stop a service that is already running.

My Raspberry Pi is a scratch server on my private home network, but it's still important to keep it updated with the latest patches. When you're managing your server with Cockpit, you may notice an alert icon next to the "Software Updates" tab. That lets you know your system needs to be updated. You can choose to update everything by clicking the "Install all patches" button, or only install the most critical patches by clicking the "Install security updates" button.

And despite all that Cockpit has to offer, if you must do something manually on the server, you can click into the "Terminal" tab to bring up an interactive shell. This is convenient if you need to do something on the command line, including editing configuration files or running scripts.
The default terminal view is white-on-black text, with the "Black" color profile. You can change the colors to your preferences using the "Appearance" menu, to set the colors to white text on a dark blue background ("Dark") or black text on an off-white background ("Light") or plain black-on-white text ("White").

Using Cockpit makes server management a breeze. I find that Cockpit helps to automate the routine stuff, and makes the hard stuff easier to do. The interface is simple yet powerful, and the interaction feels intuitive. Install Cockpit on your server, and streamline your system administration workflow.