Quick Links
Any script development usually requires troubleshooting which usually results in one of two approaches. Either manually setting variables to values and outputting that data when running the script, or utilizing debugging to set breakpoints to inspect data before continuing or aborting. Built-in to PowerShell ISE and to Visual Studio Code is the ability to perform debugging.
How does PowerShell Debugging Work?
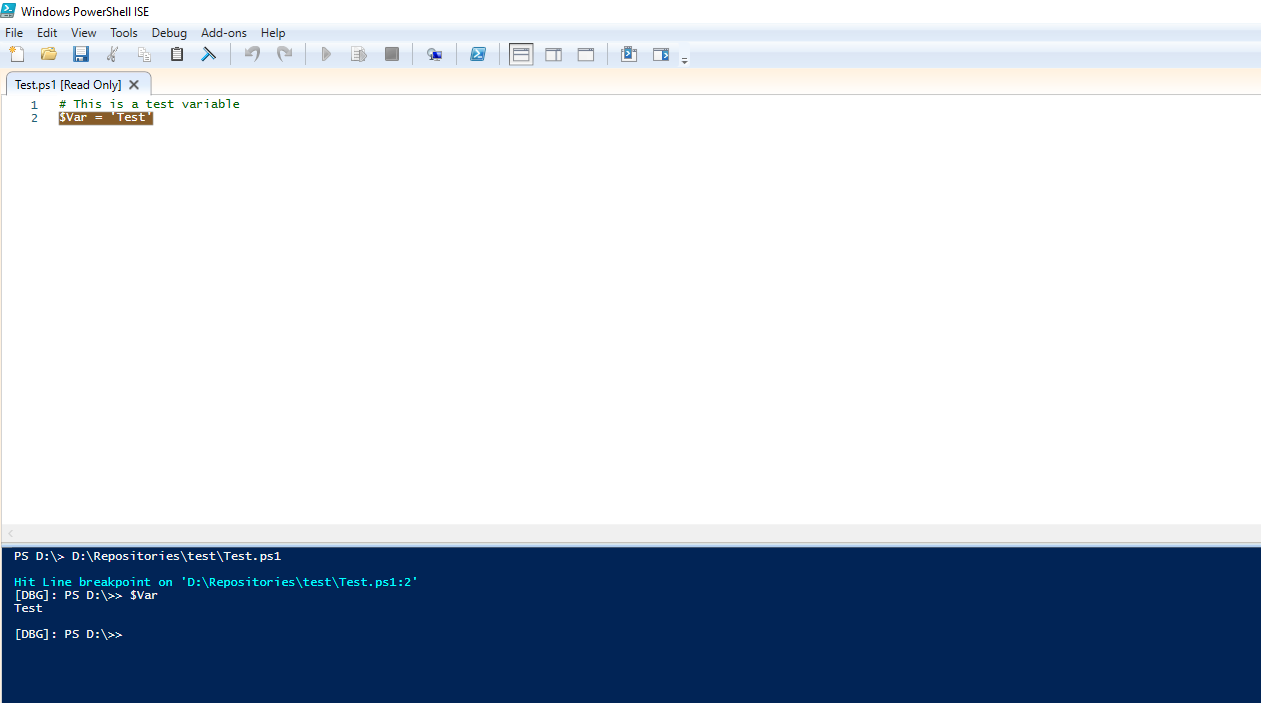
Included with Windows PowerShell, the PowerShell ISE has been the traditional go-to environment to debug PowerShell scripts. With a built-in menu for debugging and a graphical representation of breakpoints, it is easy to get started. First, any script that you are debugging must be saved. Next, you will need to set breakpoints using one of three ways.
- On the focused line use the F9 key to set a breakpoint.
- Right-click next to a line and choose Toggle Breakpoint to set a breakpoint.
-
Use the
Set-PSBreakPoint
Once you have a breakpoint set, you can simply start debugging by running the script with F5, or Debug → Run/Continue. Once the script reaches the specified breakpoint, execution will be paused and you will need to take one of the following actions.
- Step Over - Execute only the current statement, stopping before the next statement. If the current statement is a function or script, execute the entire call before stopping.
- Step Into - Similar to Step Over, execute only the current statement, stopping before the next statement. Instead of executing the entire function or script, if called, step into the call.
- Step Out - If within a function, step out and up one level if the function is nested. If in the main script execute until the end of the script or next breakpoint, whichever is first. Skipped statements are executed but not stepped through.
When the script is stopped at a breakpoint, you can hover over a variable with the mouse cursor and see what the values of any given variable are. Additionally, you can use the command-line to output variables as well to see the current status. There are a few caveats to this.
$_
,
$Input
,
$MyInvocation
,
$PSBoundParameters
, and
$Args
will not work as they are automatic variables and not subject to debugging. One way to retrieve those values is to assign them to an intermediate variable that can then be set for a breakpoint.
PowerShell Debugging in Visual Studio Code
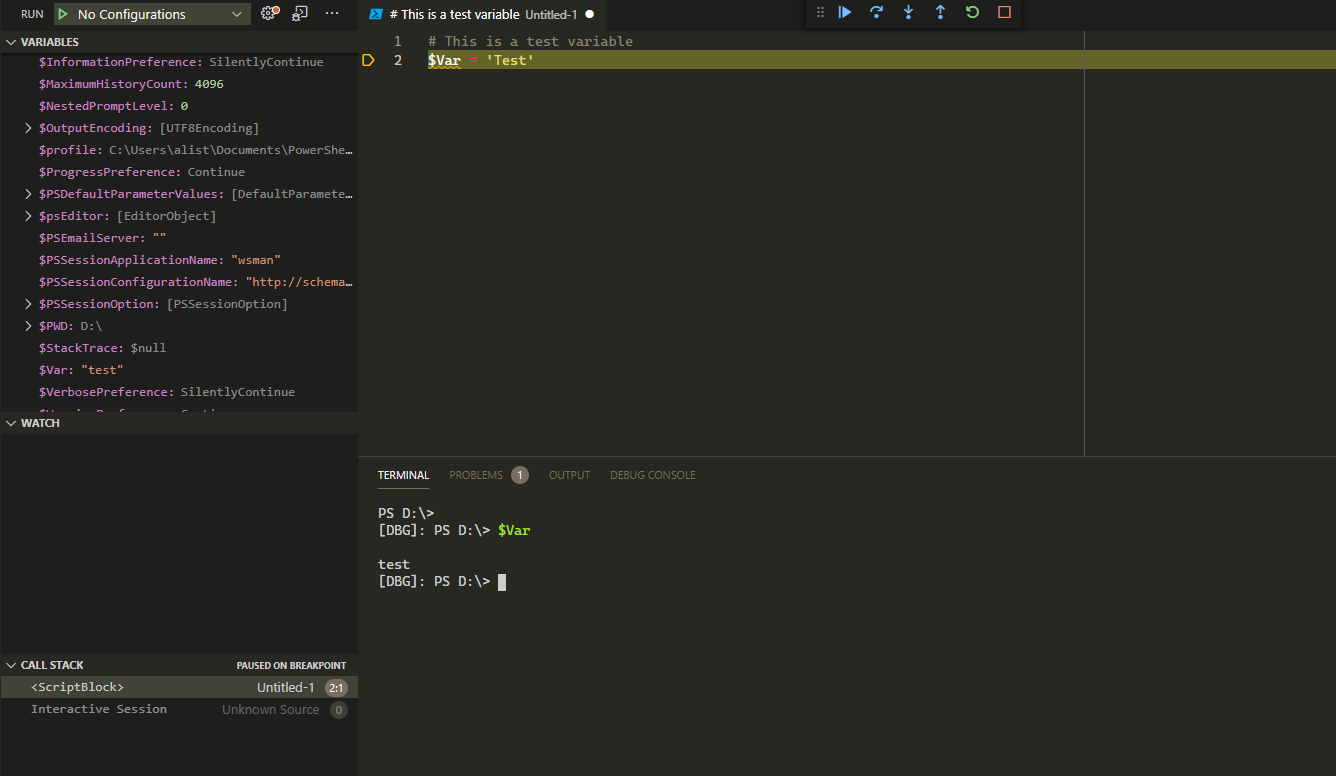
Very similar to how the PowerShell ISE works, Visual Studio Code adds several very useful debugging options. Additionally, VS Code allows you to easily debug with PowerShell 7.x while the ISE is traditionally limited to just Windows PowerShell. Using the same key-commands as the PowerShell ISE, you can quickly get started with debugging. Even better is that you now have the debugging pane within VS Code which consolidates much of the variable output and makes seeing a snapshot of all variable values in your code easier to grasp.
Using VS Code Debugging
Just like the PowerShell ISE, you can use F5 to start an interactive debugging session. Unlike the ISE, VS Code offers a much better and more useful debugging experience. Not only do you get the traditional Debug console, indicated by the
[DBG]
prompt, but you have all of the known variables and their output in the left-hand debugging pane. To make navigating debug options better, the top debug bar makes stepping into, out, and over breakpoints very easy. Also, you are not required to save before running!
The PowerShell extension of VS Code is required for this to work easily.
Using the Command Debugging Commands
Although debugging strictly from the command-line is not the easiest operation to do at times, you can do this using the built-in debugging commands. There are a few built-in commands to make this easy.
-
<a href="https://docs.microsoft.com/en-us/powershell/module/microsoft.powershell.utility/set-psbreakpoint?view=powershell-7.1">Set-PSBreakPoint</a> -
<a href="https://docs.microsoft.com/en-us/powershell/module/microsoft.powershell.utility/get-psbreakpoint?view=powershell-7.1">Get-PSBreakPoint</a> -
<a href="https://docs.microsoft.com/en-us/powershell/module/microsoft.powershell.utility/remove-psbreakpoint?view=powershell-7.1">Remove-PSBreakPoint</a> -
<a href="https://docs.microsoft.com/en-us/powershell/module/microsoft.powershell.utility/disable-psbreakpoint?view=powershell-7.1">Disable-PSBreakPoint</a> -
<a href="https://docs.microsoft.com/en-us/powershell/module/microsoft.powershell.utility/enable-psbreakpoint?view=powershell-7.1">Enable-PSBreakPoint</a>
Using the versatile
Set-PSBreakPoint
, you can quickly set a breakpoint that once hit will drop you into the debugging command prompt. At that point, using the standard key-combinations you can quickly inspect variables and continue or break execution at that point.
Conclusion
Debugging does not need to be difficult and once you get started with this using any of the above methods, you will find it integral to your script development needs. Check out how you can get started with PowerShell Debugging today!


