Quick Links
Most cloud providers divide their offerings by number of CPU cores and amount of RAM. Do you need a large multicore server, or a whole fleet of them? Here's how to go about measuring your server's real-world performance.
Does Your Application Need to "Scale"?
It's very common for tech startups to be attracted to "scalable" architecture---that is, building your server architecture in such a way that every component of it can scale to meet any amount of demand.
This is great and all, but if you're not experiencing that amount of real-world traffic, it can be overkill (and more expensive) to build scalable architecture with the intent of scaling up to a million users if you're only managing a few thousand.
You'll want to prioritize building a good app over building exceptional infrastructure. Most applications run surprisingly well with only a few easy-to-manage standard servers. And, if your app ever does make it big, your growth will likely happen over the course of a few months, giving you ample time (and money) to work on your infrastructure.
Scalable architecture is still a good thing to build around though, especially on services like AWS where autoscaling can be used to scale down and save money during non-peak hours.
You Must Plan for Peak Load
The most important thing to keep in mind is that you're not planning around average load, you're planning around peak load. If your servers can't handle your peak load during midday, they haven't served their purpose. You need make sure you're measuring and understanding your server's load over time, rather than just taking a look at CPU usage in a single moment.
Scalable architecture come in handy here. Being able to quickly spin up a spot instance (which is often much cheaper) to take some of the load off of your main servers is a very good design paradigm, and enables you to significantly cut costs. After all, if you only need two servers for a few hours a day, why pay to run it overnight?
Most big cloud providers also have scalable solutions for containers like Docker, which let you scale things up automatically since your infrastructure can be duplicated more easily.
How Much Performance Does Your Server Give?
It's a hard question to answer exactly; everyone's applications and websites are different, and everyone's server hosting is different. We can't give you an exact answer on which server fits your use case the best.
What we can do is tell you how to go about experimenting for yourself to find what works best for your particular application. It involves running your application under real-world conditions, and measuring certain factors to determine if you're over- or underloaded.
If your application is overloaded, you can spin up a second server and use a load balancer to balance traffic between them, such as AWS's Elastic Load Balancer or Fastly's Load Balancing service. If it's significantly underloaded, you may be able to save a few bucks by renting a cheaper server.
CPU Usage
CPU usage is probably the most useful metric to consider. It gives you a general overview of how overloaded your server is; if your CPU usage is too high, server operations can grind to a halt.
CPU usage is visible in
top
, and load averages for the last 1, 5, and 15 minutes are visible as well. It gets this data from
/proc/loadavg/
, so you can log this to a CSV file and graph it in Excel if you want.
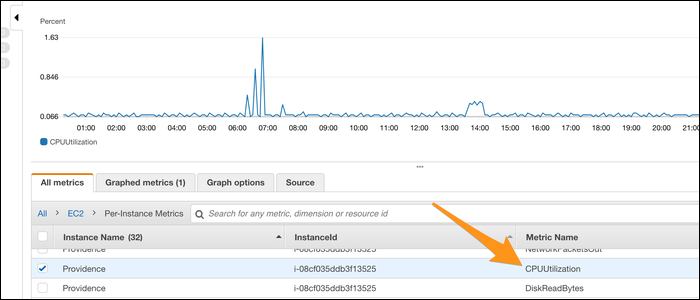
Most cloud providers will have a much better graph for this though. AWS has CloudWatch, which displays CPU usage for each instance under the EC2 metrics:
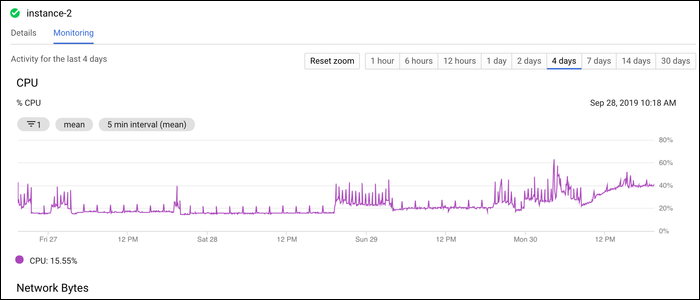
Google Cloud Platform shows a nice graph under the "Monitoring" tab in the instance info:
In both graphs, you can adjust the timescales to display CPU usage over time. If this graph is constantly hitting 100%, you may want to look into upgrading.
Keep in mind, though, that if your server has multiple cores, CPU usage may still be "overloaded," while the graph is nowhere near 100%. If your CPU usage is pinned near 50%, and you have a dual-core server, it's likely that your application is mostly single threaded, and isn't seeing any performance benefits.
RAM Usage
RAM usage is less likely to fluctuate much, as it's largely a question of whether or not you have enough to run a certain task.
You can view memory usage quickly in
top
, which displays the currently allocated memory for each process in the "RES" column, as well as displaying usage as a percentage of total memory in the "%MEM" column.
You can press Shift + M to sort by %MEM, which lists out the most memory-intensive processes.
Note, memory speed does affect CPU speed to a certain extent, but it likely isn't the limiting factor unless you're running an application that requires bare metal and the fastest speeds possible.
Storage Space
If your server runs out of space, it can crash certain processes. You can check disk usage with:
df -H
This displays a list of all devices attached to your instance, some of which may not be useful to you. Look for the biggest one (probably /dev/sda1/), and you can see how much is currently being used.
You need to make effective use of log rotation, and make sure there's nothing creating excess files on your system. If there is, you may want to limit it to only storing the last few files. You can delete old files by using find with time parameters, attached to a cron job that runs once an hour:
0 * * * * find ~/backups/ -type f -mmin +90 -exec rm -f {} ;
This script removes all files in the ~/backups/ folder older than 90 minutes (used for a Minecraft server that was making 1GB+ sized backups every 15 minutes, filling up a 16GB SSD). You can also use logrotate, which achieves the same effect more elegantly than this hastily written command.
If you're storing a ton of files, you may want to consider moving them to a managed storage service like S3. It will be cheaper than having drives attached to your instance.
Network Speed
There isn't a great way to monitor this natively, so if you want to get a good command line output, install sar from sysstat:
sudo apt-get install sysstat
Enable it by editing /etc/default/sysstat and setting "ENABLED" to true.
Doing so monitors your system and generates a report every 10 minutes, rotating them out once a day. You can modify this behavior by editing the sysstat crontab at /etc/cron.d/sysstat.
You can them collect an average of network traffic with the -n flag:
sar -n DEV 1 6
The, pipe it to tail for nicer output:
sar -n DEV 1 6 | tail -n3
It displays an average of packets and kilobytes sent per second on each network interface.
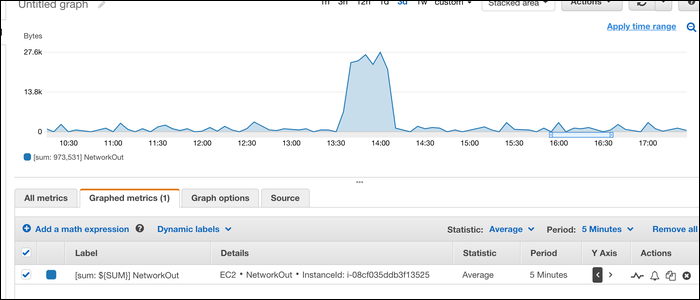
It's easier to use a GUI for this, though; CloudWatch has a "NetworkIn" and "NetworkOut" statistic for each instance:
You can add a dynamic label with a SUM function, which displays the total network out in bytes for a given time period.
Whether or not you're overloading your network is hard to judge; most of the time, you are limited by other things, such as whether or not your server can keep up with requests, before worrying about bandwidth usage.
If you're really worried about traffic or want to serve large files, you should consider getting a CDN. A CDN can take both some load off of your server and enable you to serve static media very efficiently.


