Quick Links
That application crash need not be the end of the journey! Learn the basics of using GDB, the powerful GNU Debugger and know how to debug core dumps on Linux. Ideal for end users and debugging newcomers alike.
What Is GDB?
The GDB tool is an old-timer, highly respected, debugging utility in the Linux GNU Toolset. It provides it's own command line, a broad array of commands and functions, and step-by-step program (computer code) execution and even modification functionality.
Development on GDB started somewhere in 1986-1988, and in 1988 the tool became part of the Free Software Foundation. It is completely free and can be installed easily on all major Linux distributions.
If you into Windows, then you may like to read Windows Memory Dumps: What Exactly Are They For? instead!
For Linux users, it is important to understand where GDB fits into the process flow when considering computer bugs and errors. There are three possible scenarios. Firstly, there can be an end user running into an application crash who would like to learn a little more about what happened, and figure out if the bug is already known by the community, etc.
This is a common situation, and most advanced users at one point or another will find themselves debugging an application crash. Knowing GDB helps tremendously with this task. More on this below.
The second scenario is a professional (for example an IT consultant or test engineer) running into a crash with an application they also support or maintain. In such cases, the engineer will likely want to debug the crash seen, especially if they are a test engineer, to for example get a backtrace (an overview) of what functions were running at the time of the crash etc. This may help to define the bug better and may help to narrow down a test case.
The third scenario is that of a developer, who will want to use GDB at a more professional level to for example set breakpoints, debug variable watches, do core dump analysis etc. While the scope of this article is a little light for such professionals, there will be a more in-depth GDB article following later. And, if you are a developer and have never worked with GDB, keep reading.
What Is a Core Dump?
If you ever watched Star Trek and heard Captain Picard (or Janeway!) give instruction to "dump the warp core" you will have a fairly good picture of what a core dump may look like. It was basically the core component (the warp core) being ejected as a result of some perceived failure or issue. It was likely a pun take on Linux core dumping.
All fun aside, a core dump is simply a file generated with the (full or partial) state (and memory) of an application, at the time that it crashed.
A core dump is a binary file, which can only be read by a debugger. GDB is such a debugger, and one of the best. The core dump can be written by the crashing application itself (not commonly employed, though it is possible and some larger sever-scale software may use this), but is more often written by the operating system itself.
Some operating systems have core dumping disabled by default, or they minimize the core dumps to a mini dump, which may help with debugging the application, but will likely be much more limited then a full core dump. Then again, a full core dump can be problematic; for example, if you have a system with 128GB of memory, and your application is using most of that memory, a core dump (the file on disk) may be of approximately equal size.
Configuring core dumps on your particular OS is outside of the scope of this article, but this information is relatively easy to find online. Simply search your favorite search engine for a phrase like 'Configure core dumps on Linux Mint', replacing 'Mint' with your Linux operating system name.
Depending on your operating system and it's current setup, it may take a little tweaking and editing in configuration files, a few reboots and at times some light resolving of issues, but once set, you'll be able to use GDB against the core dumps written whenever an application crashes.
Please note that enabling the writing of core dumps on your operating system will as good always be limited to changing configuration settings in existing (or new) configuration files. No other applications need to be installed for core dumps to be enabled and written whenever an application crashes. The tool GDB however, needs to be installed, but will be available in your major Linux distribution's application repository by default.
Installing GDB
To install GDB on your Debian/Apt based Linux distribution (Like Ubuntu and Mint), execute the following command in your terminal:
sudo apt install gdb
To install GDB on your RedHat/Yum based Linux distribution (Like RHEL, Centos and Fedora), execute the following command in your terminal:
sudo yum install gdb
Core Dump Locations and Issue Reproducibility
Once you have core dumps enabled, and GDB installed, it is time to find and read your core dump (the file generated by the operating system when your application crashes) with GDB.
If you configured your system for core dumps after your application crashed, it is somewhat likely that no core dump is available for the previous crash. Try and take the same steps in your application to reproduce the crash/issues.
Once that happened, check the default location for core dumps on your Linux distribution (like
/var/crash
or
/var/lib/systemd/coredump/
on Ubuntu/Mint and Centos or
/var/spool/abrt
on RedHat). Regularly, and at times depending on the settings made, a core dump may have also been written to the directory where the binary (the application) resides (likely), or to it's main working directory (somewhat less likely).
From the ambiguity of the verbiage, you may get the impression that chasing core dumps may be somewhat elusive. That would be an accurate assessment. Whereas the GDB tool itself is very stable, resilient and mature, writing core dumps is a much more haphazard endeavor. There are several reasons for this, the main one being that most major Linux distributions have different implementations of core dumping behavior, and a variety of configuration settings to match.
The writing of core dumps also touches, rather significantly, on security; after all the computer's main memory, in full or in part, are written to the dump, enabling GDB users to read back potentially confidential information. Furthermore, as explained earlier, at times core dump writing can be limited by system resources.
Finally, we are dealing with a crashing application in an unknown state, and it is not always possible to write such a state to disk. It is fair to say that one may expect to spend some time to get core dumping to work reliably and persistently on a given system. This then brings us to the topic of issue reproducibility.
If you have an issue which is consistently reproducible, like your computer always crashing when you play a music file, then configuring core dumps and debugging the same using GDB makes a lot of sense. I once discovered a bug in an Audio driver this way. If you are a test engineer and are repetitively testing a given program, then it makes sense to configure core dumps and use GDB all the more.
However, if you have a single instance of an application crashing, and the issue is not readily reproducible, then you have a choice to make. If you want to be prepared for the next crash of the application, and/or if the application is very important to you (for example for business continuity) then you will want to at least configure core dumps so next time the application crashes, a core dump is generated. GDB can be installed even after a core dump was generated.
Reading the Core Dump with GDB
Now that you have a core dump available for a given crashing application, and have installed GDB, you can easily invoke GDB:
gdb ./myapp ./core
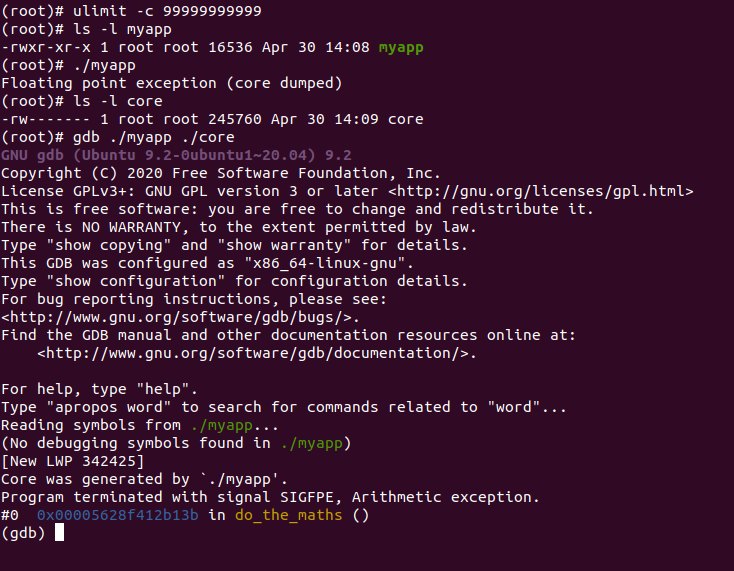
Here we have an application called myapp which crashes as soon as it is started. On this Ubuntu system, core dumps were enabled by simply setting ulimit -c to a higher number as root and then starting the application. The result is a core dump generated as ./core.
We invoke gdb with two options. The first option is the application/binary/executable which generated a crash. The second is the core dump generated by the operating system as a result of the application crashing.
Initial Analysis of the Core Dump
When GDB starts, as can be seen in the GDB output in the image above, it provides a plethora of information. Carefully reviewing this can provide us with a lot of information about the issue which your system experienced resulting in the application crash.
For example, we immediately note that the program terminated due to SIGFPE error, an arithmetic exception. We also confirm that GDB has correctly identified the executable by the Core was generated by `./myapp' line.
We also see the interesting line/notion No debugging symbols found in ./myapp indicating that debug symbols could not be read from the application binary. Debug symbols is where things can get murky quickly. Most optimized/release level binaries (which would be most of the applications you are running day-to-day) will have the debug symbol information stripped from the resulting binary to save space and increase application runtimes/working efficiency.
Depending on how much was stripped from the resulting optimized binary, even simple function names may not be available. In our case, the function names are still visible, as can be observed from the do_the_maths() function name reference. However, no variables are visible and this is what GDB was referring to with the No debugging symbols found in ./myapp note. When function names are not available, function name references will render as ?? instead of the function name.
We can see however what the crashing frame/function name is: #0 do_the_maths(). You may be wondering what a frame is. The best way to describe and think about a frame is to think about functions, for example do_the_maths(), in a computer program. A single frame is a single function.
Thus, if a program steps through various functions, for example the main() function in a C or C++ program which in turn may call a function called math_function() which finally calls do_the_maths() would lead to three frames, with frame #0 (the final resulting and crashing frame) being the do_the_maths() function, frame #1 being the math_function() and frame #2 (the first called frame, with the highest number) being the main() function.
It is not uncommon to see a 10-20 frames stack in some computer programs, and an occasional 40 or 50 frame stack is quite possible in for example database software. Note that the order the order of the frames is in reverse; crashing frame with frame number #0 first, then going up from there back to the first frame. This makes sense when you think from the debugger/core dump perspective; it started at the point where it crashed, then worked it's way back up to the frames all the way to the main() function.
The term frame stack should now be more self-explanatory; a stack of frames, from most-specific (i.e. do_the_maths) to least-specific (i.e. main()) which will guide us in evaluating what happened. So, can we see this stack/frame stack in GDB for our current issue? We sure can.
Backtrace Time!
Once we have arrived at the gdb prompt, we can issue a backtrace bt command. This command will - for the current thread only (which is most often the crashing thread; GDB auto-detects the crashing threads and auto-places us in that thread, though it does not always get it correct) - dump a backtrace of the frame stack, which we discussed above. In other words, we'll be able to see the flow-through-the-functions the program went through up to the moment it crashed.
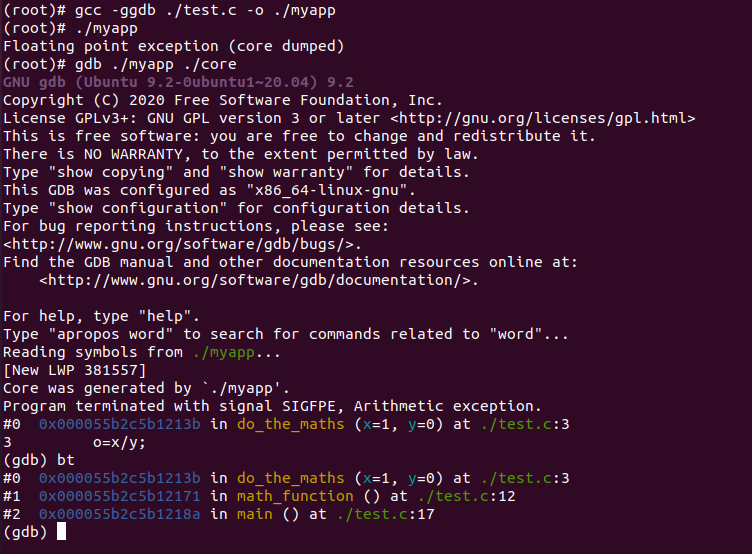
Here we executed the bt command, which gives us a nice call stack, or frame stack, or stack, or backtrace - whatever word you prefer, they all mean exactly the same thing. We can see that main() called math_function which in turn called the do_the_maths() function.
As we can see, variable names are not displayed in this particular output, and GDB notified us that debug symbols were not available. Though the resulting binary still had some level of debugging information available, as all frame/function names showed correctly and no frames rendered as ??.
I thus recompiled the application from source using the -ggdb option to gcc (as in gcc -ggdb ...) and note how there is much more information available:
This time we can clearly see that GDB is reading symbols (as indicated by Reading symbols from ./myapp...), and that we can see variable names like x and y. Provided that the source code is available, we can even see the exact source code line where the issue happened (as indicated by 3 o=x/y;). We can also see the source code lines for all frames.
Studying the output a little, we immediately realize what is wrong. The variable o was being set to the variable x being divided by y. However, looking a little closer at the function's input (shown by (x=1, y=0)), we see that the application tried to divide a number by zero, which is a mathematical impossibility, leading to the SIGFPE (Arithmetic exception) signal.
Our issue is thus no different from typing 1 divided by 0 on your calculator; it too will complain, though not crash ;)
In such a case, a workaround may be devised by providing different input to the application (where you are trying to work around a certain crash and do not have the source code available) - for example you could try and input 0.000000001 instead of 0 and accept a small rounding adjustment, or - provided the source is available and you are improving source code as a developer - you could add some additional code in your program to cater for mistaken inputs to the y variable.
As you can see, GDB is a very versatile tool, in the variety of roles and situations one may find themselves in. Furthermore, we have only just scratched the surface of what the cool can do. It is also exactly depending on the situation and the surrounding information (is a core dump available, do we have debug symbols, etc.) how far one can take the GDB journey in each instance. But one thing is clear; one is much more likely to debug a given situation more fully if, when and how core dumps and GDB are used.
Wrapping up
In this article, we introduced GDB, the GNU debugger which can be easily installed and used on any major Linux distribution. We discussed the need to configure core dumps on the target system first, and the intricacies thereof. We saw how to install GDB, allowing us to read and process the generated core dumps.
We next reviewed basic interfacing between the core dump and the user or developer, and provided a practical example of an actual analysis, looking at the bt backtrace command. We also discussed optimized versus debug [symbol] instrumented application builds and how this affects the level of information visibility inside GDB.
In a future article, we'll dive deeper into GDB and explore more advanced GDB use.
Enjoy Debugging!


