Quick Links
The powerful GNU Debugger GDB returns to the front stage. We dive deeper into stacks, backtraces, variables, core dumps, frames, and debugging than ever before. Join us for an all-new, more advanced introduction to GDB.
What Is GDB?
If you are new to debugging in general, or to GDB---the GNU Debugger---in particular, you might want to read our Debugging with GDB: Getting Started article first, and then return to this one. This article will continue to build further on the information presented there.
Installing GDB
To install GDB on your Debian/Apt-based Linux distribution (like Ubuntu and Mint), execute the following command in your terminal:
sudo apt install gdb
To install GDB on your RedHat/Yum-based Linux distribution (like RHEL, Centos, and Fedora), execute the following command in your terminal:
sudo yum install gdb
Stacks, Backtraces, and Frames!
It sounds like apples, pie, and pancakes! (And to some extent, it is.) Just like apples and pancakes feed us, stacks, backtraces, and frames are the bread and butter of all developers debugging in GDB, and the information presented within them richly feeds a developer hungry to discover his or her bug in source code.
The bt GDB command will generate a backtrace of all functions that were called, one after the other, and present us with the frames (the functions) listed, one after the other. A stack is quite similar to a backtrace in that a stack is an overview or list of functions that led to a crash, situation, or issue, whereas a backtrace is the command that we issue to get a stack.
That being said, often, the terms are used interchangeably, and one might say "Can you get me a stack?" or "Let's view the backtrace," which somewhat reverses the meaning of both words in each sentence, respectively.
And as a refresher from our previous article on GDB, a frame is basically a single function listed in a backtrace of all nested function calls---for example, the
main()
function starting first (listed at the end of a backtrace), and then
main()
called
math_function()
, which in turn called
do_the_maths()
etc.
If this sounds a little complicated, have a look at Debugging with GDB: Getting Started first.
For single-threaded programs, GDB will, as good as always (if not always), correctly discover the crashing (and only) thread when we start our debugging adventure. This makes it easy to immediately execute the bt command when we enter
gdb
and find ourselves at the
(gdb)
prompt, as GDB will immediately show us the backtrace relevant to the crash that we observed.
Single-threaded or Multithreaded?
A very important matter to observe (and know) when debugging core dumps is whether the program being debugging is (or perhaps more specifically, was) single-threaded or multithreaded?
In our previous example/article, we took a look at a simple backtrace, with a set of frames showing from a self-written program. The program was single-threaded: No other execution threads were forked from within the code.
However, as soon as we have multiple threads, a single bt (backtrace) command will only produce the backtrace for the thread that is currently selected inside GDB.
GDB will automatically select the crashing crash, and even for multithreaded programs, this is, 99%+ of the time, correctly done. There are only occasional instances where GDB will mistake the crashing thread for another. For example, this might happen if the program has crashed in two threads at the same time. In the last 10 years, I have only observed this less than a handful of times while handling thousands of core dumps.
To demonstrate the difference between the example used in our last article and a true multithreaded application, I built MySQL server 8.0.25 in debug mode (in other words, with debug symbols/instrumentation added) using the build script in the MariaDB-a GitHub repo and ran the pquery framework SQL data against it for a bit, which soon enough, crashed the MySQL debug server.
As you might remember from our previous article, a core dump is a file produced by the operating system, or in some cases, by the application itself (if it has crash-handling/core-dumping provisions built-in), which can then be analyzed by using GDB. A core file is usually written as a restricted privileges file (to protect confidential information contained in memory), and you will likely need to use your superuser account (i.e.,
root
) to access it.
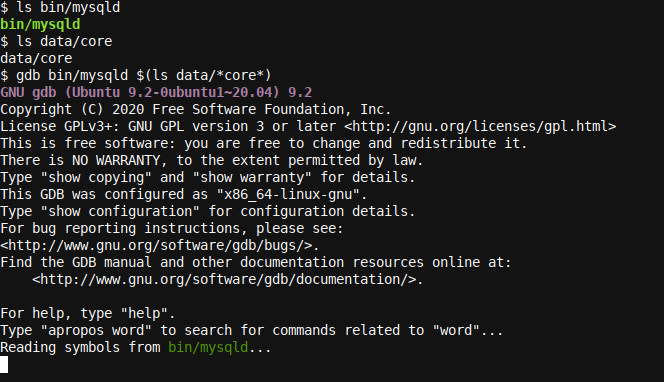
Let's dive right into the core dump produced with
gdb bin/mysqld $(ls data/*core*)
:
And a few seconds later, GDB finishes loading and brings us to the GDB prompt:
The various New LWP messages (which were even more numerous in the full output) give a good hint that this program was multithreaded. The term LWP stands for Light Weight Process. You can think of it as being equivalent to a single thread each, together making a list of all the threads that GDB discovered while analyzing the core. Note that GDB must do this upfront so that it might find the crashing thread as described earlier.
Also, as we can read on the last line of the first GDB startup image above, GDB initiated a
Reading symbols from bin/mysqld
action. Without the debug symbols built/compiled into the binary, we would have seen some or most frames marked with a function name
??
. Additionally, no variable readouts would be presented for those function names.
This issue (unresolvable frames seen when debugging specific optimized/stripped binaries that have had their debug symbol stripped/removed) is not easily resolved. For example, if you were to see this on a production level database server binary (that has the debug symbols stripped/removed to optimize runtime, etc.), you would have to follow generally more complex procedures, like, for example, How to Produce a Full Stack Trace for mysqld.
Backtraces!
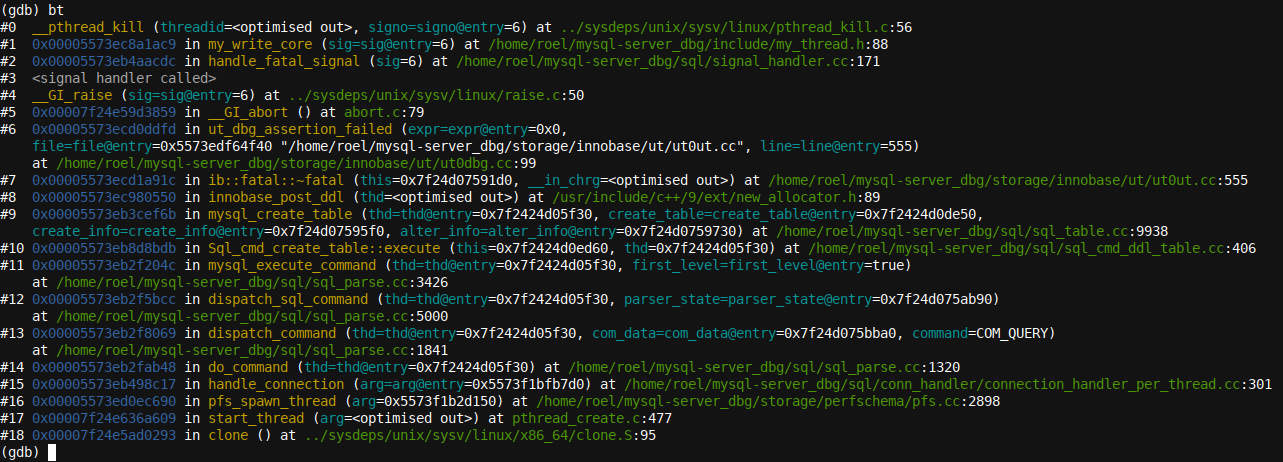
As we have compiled the MySQL server with debug symbols included, a backtrace will correctly display all function names in our case. We issue a bt command at the
(gdb)
prompt, and our backtrace output is as follows:
So, how do we see a backtrace for all threads or a different thread? This can be achieved by using the commands
thread apply all bt
or
thread 2; bt
, respectively. We can swap the
2
in the last command to access another thread, etc. While the
thread apply all bt
output is a little verbose to insert here, here is the output when swapping to another thread and obtaining a backtrace for that thread:
Carefully reading any computer error log or trace will, as good as always, reveal more details easily missed when just glancing at information. This is a real skill. One of my earlier IT managers made me aware of the great need to do so, and I hereby pass on the same information to all avid readers of this article. To back that statement up with some proof, take a close look at the backtrace produced, and you will notice the terms listen_for_connection_event, poll, Mysqld_socket_listener, and connection_event_loop for Mysqld_socket_listener. It's quite clear: This thread is waiting for input.
This is just an idle thread that was likely waiting for a MySQL client to connect or input a new command or something similar. In other words, there would be as good as zero value in continuing to debug this thread.
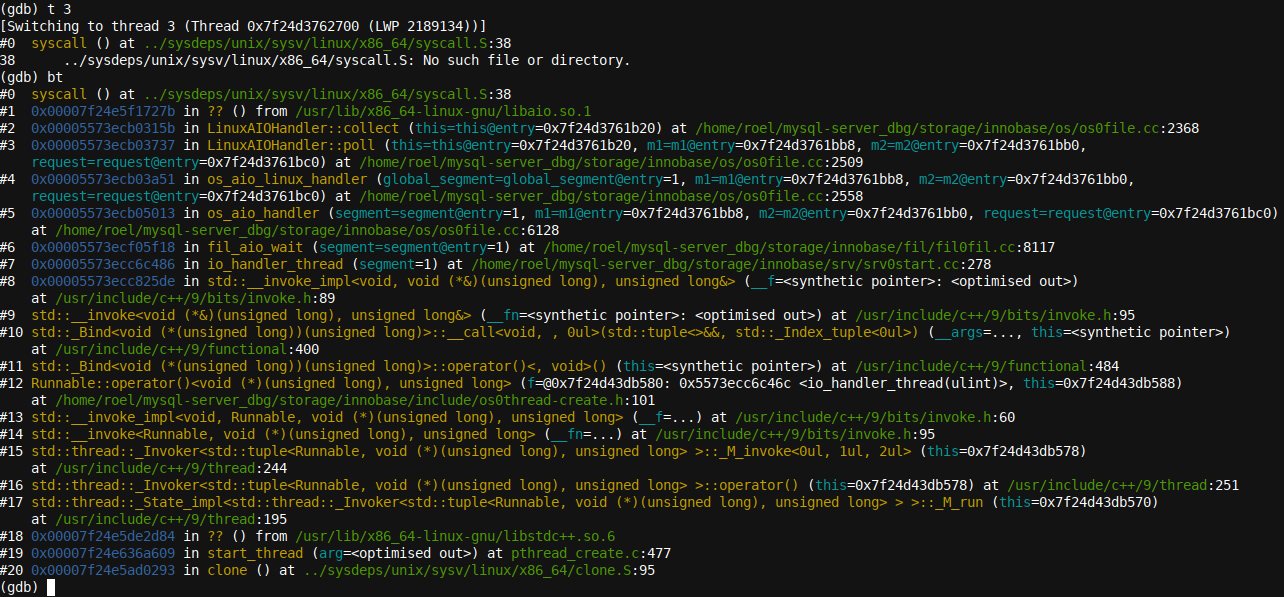
This also brings us back to how handy it is to have GDB automatically present the crashing thread to us at startup. All we have to do to start our debugging adventure is to get a backtrace. Then, when analyzing multiple threads and their interaction, it makes sense to jump between threads with the thread command. Note that this can be abbreviated to
t
:
Interestingly, here, we have
thread 3
, which is also in some polling loop and looks like (
LinuxAIOHandler::poll
), although, in this case, it's at the OS/Disk level (as signified by the terms
Linux
,
AIO
, and
Handler
), and a closer look reveals that it's waiting, it seems, for AIO to complete:
fil_aio_wait
.
As you can see, there's a lot of information about the state of a program at the moment it crashes, which can be glanced from the logs if one looks closely enough.
Here's a tip: You can use the
set log on
command in GDB if you'd like to save all information to disk so that you can easily search the output later, and you can use
set log off
to end the output trace. The information is stored to
gdb.txt
by default.
Jumping into Frames
Just like we saw, it's possible to swap between threads and even obtain a backtrace for all logs at once, and it's just as possible to jump into individual frames! We can even---provided that the source code is available on the disk and is stored in the original disk location (i.e., the same source code directory that was used when building the product)---see the source code for a particular frame that we're in.
Some care has to be taken here. It's quite easy to mismatch binaries, code, and core dumps. For example, trying to analyze a core dump created with version v1.0 of a given program probably won't be compatible with the version v1.01 binary compiled somewhat later with v1.01 code. Also, one couldn't [always] use the v1.01 source code to debug a core dump written with version v1.0 of a program, even if the v1.0 binary is available, too.
The word always was placed as an optional, as sometimes---if the code in that section of the code and program being debugged hasn't changed since the last version---it might be possible to use older source code.
This practice is perhaps frowned upon, as a few simple changes in the code might make the code lines no longer correspond to the binary and/or core dump. It's best to either never mix different versions of the source code, the binaries, and the core dumps, or to only rely on the core dump and the binary, both of the same version, without the source code or with the source code referred to manually only.
Still, if you're analyzing many cores that customers sent in, often with limited information, sometimes, one can get away with using a slightly different version of the source code, and perhaps, even a slightly different binary (less likely), although, always realize that the information presented by GDB will very likely be invalid in part, or more likely, in full. GDB will also warn you at startup if it is able to detect a mismatch between the core and the binary.
For our example, the source, the binary, and the core dump are all made with the same version of source code and with each other, and we can thus happily trust GDB when it produces output like backtraces.
There's one other small exception here, and that is stack smashing. In such a case, you will either observe error messages in GDB, see
??
frame names---similar to the situation described above (but this time, as a result of the unreadability of a core dump in combination with the binary)---or the stack will look really odd and incorrect. Most of the time, it will be quite clear. At times, a really bad bug can cause stack smashing.
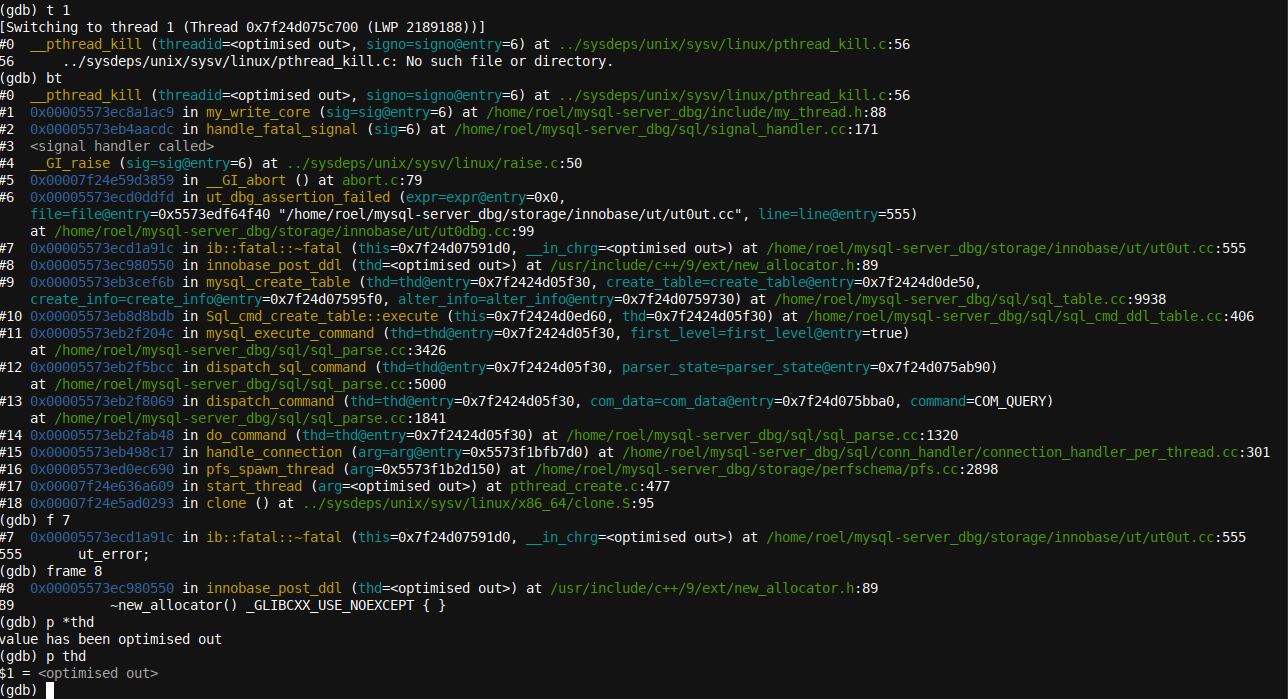
Let's now jump into a frame and see what some of our variables and code look like:
Variables
t 1

            bt

            f 7

            frame 8

            p *thd

            p thd
Here, we entered various commands to navigate to the right thread and run a backtrace (t 1 took us to the first thread, the crashing thread in our example, followed by the backtrace command bt), and subsequently, jumped to frame 7 and then frame 8 using the f7 and frame 8 commands, respectively. You can see how, similar to the thread command, one can abbreviate the frame command to its first letter, f.
Finally, we tried to access the thd variable, although this was optimized out of the trace/core dump for this particular frame. The information is available, however, if we simply jump into the right frame, which has the variable available and was not optimized out (a bit of trial and error might be required):
In the last two screenshots above, I showed two different ways of typing the print (again, abbreviated in a similar fashion to just p) command, the first one with a leading * for the variable name, the second without).
The interesting bit here is that the second is more often used, but will generally only provide a memory address for the variable in question, which is not very handy. The * version of the command (p *thd) will resolve the variable to its full contents instead. Also, GDB knows the variable type, so there's no need to typecast (cast the value to a different variable type).
Wrapping up
In this more in-depth GDB guide, we looked into stacks, backtraces, variables, core dumps, frames, and debugging. We studied some GBD examples and gave some important tips for the avid reader on how to debug well and successfully. If you enjoyed reading this article, take a look at our How Linux Signals Work: SIGINT, SIGTERM, and SIGKILL article.

