Storage Lens is a new analytics tool for AWS's Simple Storage Service (S3) that can help customers optimize their storage. Storage Lens can give you a great overview of your buckets, as well as provide useful insights into cost efficiency and data protection.
What Is Storage Lens?
Storage Lens is a visualization dashboard for bucket metrics. While buckets have their own metrics panels, Storage Lens can show metrics for multiple buckets at once.
On top of being great for single users, Storage Lens also works for buckets across accounts in your AWS Organization. This can be particularly useful to give a single overview for accounts with many buckets split across different environments.
Storage Lens is free, but the "Advanced Metrics" costs $0.20 per million objects. This includes metrics aggregated by prefix, activity metrics aggregated by bucket, 15-month data retention, and recommendations.
How To Use Storage Lens
You'll need to access Storage Lens with an IAM user, not your root account. AWS recommends that you really shouldn't be using your root account for anything other than account maintenance, but most things will still work. Storage Lens will not; you will need to either set up an admin IAM account with administrator privileges or the specific.
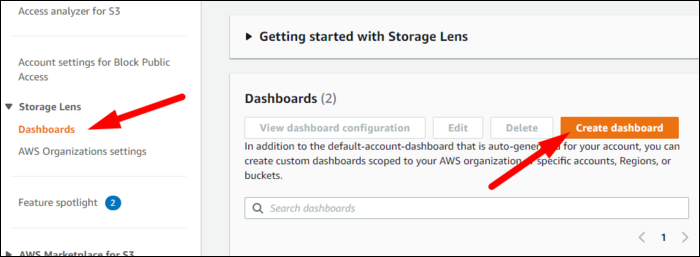
Storage Lens is a part of the S3 Management Console. You'll see a tab on the left called "Dashboards." Click this, and create a new dashboard.
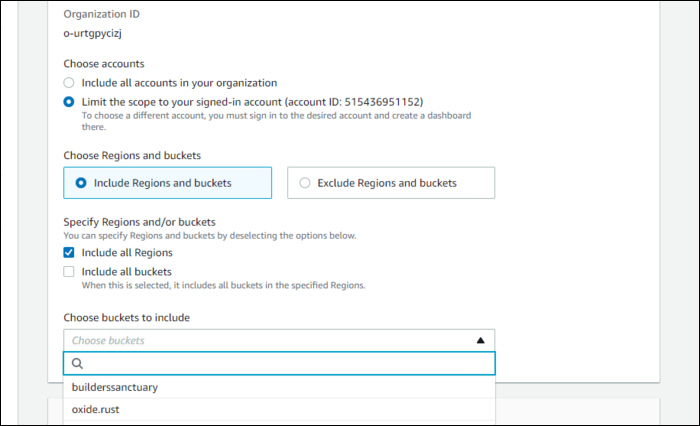
The settings are pretty simple. You may have to enable the feature in your AWS Organization. Then, you can set names and tags, specify which buckets this dashboard applies to, or enable advanced metrics. You can also set up another bucket to export metrics to.
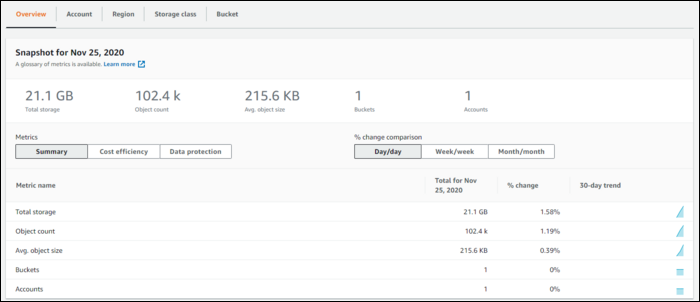
The first block shows an overview of storage, a total number of bytes across buckets, total number of objects, and the average object size. Under summary, you'll find the same metrics but with Day/day, week/week, and month/month trends. You can also view cost efficiency, which measures non-current versions, and encryption percentages for all the buckets.
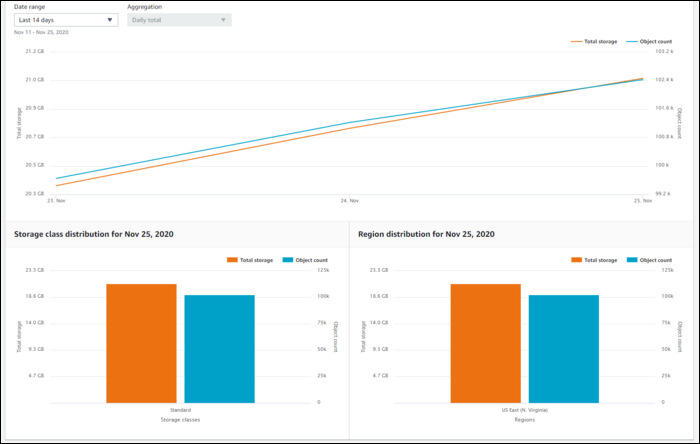
The next panel shows a graph of two metrics side by side. You can change the metric type and date ranges.
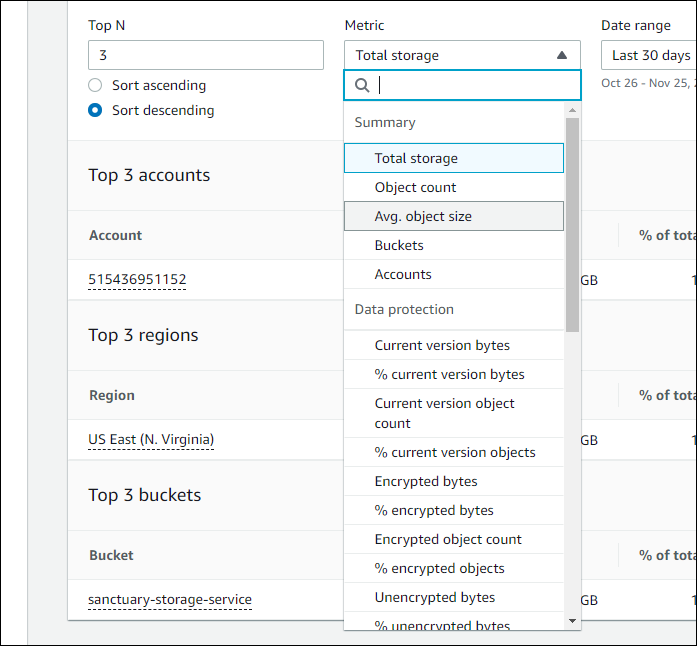
The last panel is particularly useful, as it can show the top buckets, accounts, and regions for any given metric.

