One of the ancillary benefits of our Vista Gadget breaking and my email filling up with complaints was that I learned how to debug a Vista Gadget in Visual Studio, so I'm sharing the wealth with everybody.
For this exercise you'll need a copy of Visual Studio 2005 and a broken Vista Gadget, but you can probably adapt it to work with a different tool if you try.
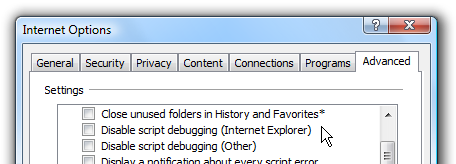
Critical Step: Enable Script Debugging
Open up Internet Explorer's Options panel, find the Advanced tab and uncheck the boxes for "Disable script debugging".
After you are done debugging you'll probably want to turn this off, as it can get quite annoying while browsing.
Open Your Gadget Code
After installing your gadget, Windows will unpack and copy the files to a folder in your user profile. We'll need to find this folder and open the javascript file that makes up the logic for your gadget.
Just paste the following into the Explorer address bar:
%LOCALAPPDATA%\Microsoft\Windows Sidebar\Gadgets

You'll see a list of directories for all the gadgets installed into your profile. Open up the main javascript file in Visual Studio.
Attach to Sidebar Process
Next we'll need to attach to the specific sidebar process for your gadget. (Make sure your gadget is running before you do this step)
Go to Tools \ Attach to Process or hit Ctrl+Alt+P to bring up the dialog.

Now you should look for a process named "sidebar.exe" with the title set to the name of your gadget, and then click the Attach button.

For a close-up view, you can see that the gadget is running under a separate process from the main sidebar, but the title is set to "How-To Geek".

Now comes the critical step... click to set a breakpoint just to the left of the white area...

If all goes well, you will immediately be taken to a new file named something like x-gadget:///main.js and your debugging tools will become active as soon as the breakpoint is hit.

Note that you can't modify this file, but you can use the Immediate Window to test out any code in real-time.
Important Notes
- When debugging a gadget that polls every so often, it would be wise to set the interval really low so that you don't have to wait very long for it to trigger.
- You can make changes in the original source file, but you will have to close/reopen the gadget and then re-attach to it.
- If you get an error about no symbols being loaded, you didn't follow the first step to enable script debugging.
- You'll have to manually enter the names of variables to watch in the Watch box, but you can step through the gadget just like a real debugger should.
Happy debugging!