Quick Links
Key Takeaways
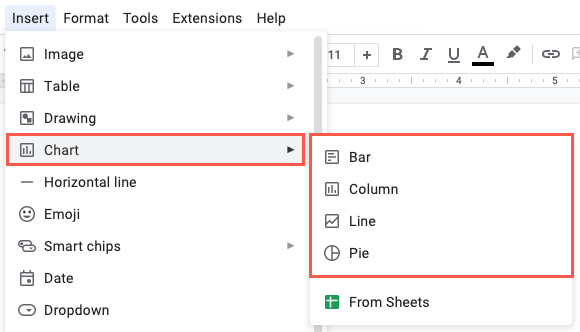
Use the Insert > Chart menu in Google Docs to isnert a chart. You can choose a variety of chart types: Bar, Column, Line, and Pie. The chart will appear with sample data and you can edit the chart's data in the connected Google Sheet.
If you want a graph in your report, proposal, or research paper, you can create one directly in Google Docs. There's no need to worry about making one elsewhere and embedding it. Simply insert your graph and add your data.
When you make a chart in Google Docs, you're directed to a Google Sheet to replace the sample data with your own. Then, you can customize the chart for the look and feel you want. Return to Google Docs and your chart is ready to update.
Insert a Chart in Google Docs
Visit Google Docs, sign in, and open an existing or new document.
Go to the Insert tab and move your cursor to "Chart." You can then choose to add a bar graph, column chart, line graph, or pie chart. Notice that you can add a graph you've already created in Google Sheets too.
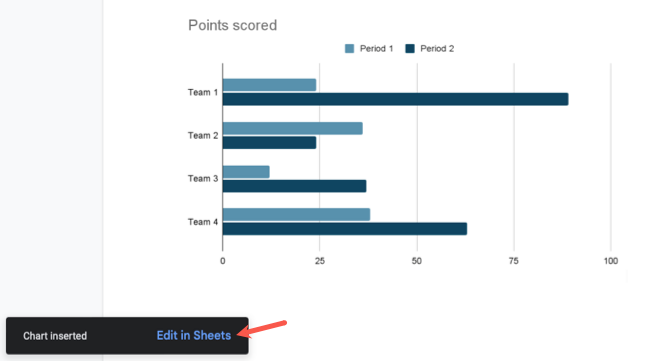
The chart you select then appears in your document with sample data. You'll see a brief message on the bottom left of Google Docs with a link to edit the chart in Google Sheets. Click "Edit in Sheets" to do so.
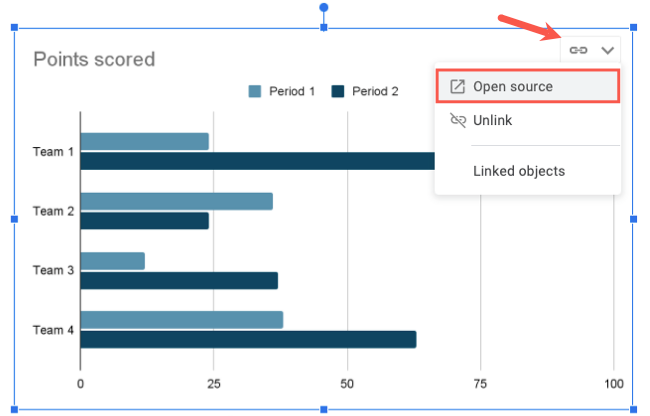
If the message vanishes before you're able to click the link, select the arrow on the top right corner of the graph and pick "Open Source."
Edit and Add the Chart Data in Google Sheets
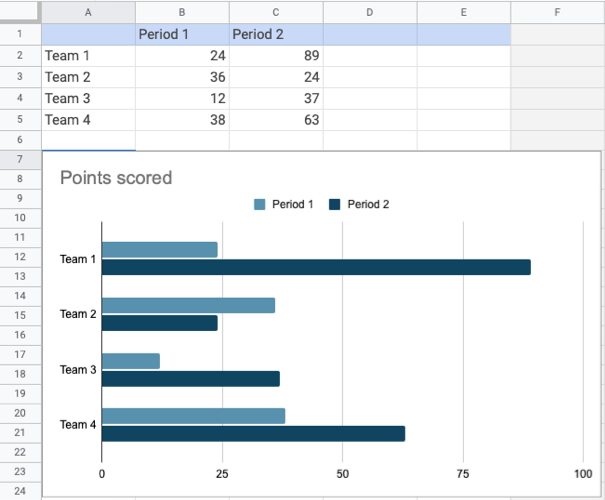
When the connected spreadsheet opens in Google Sheets, you'll see the data and the chart. You can then replace the chart's sample data in the sheet with your own. The graph then updates automatically.
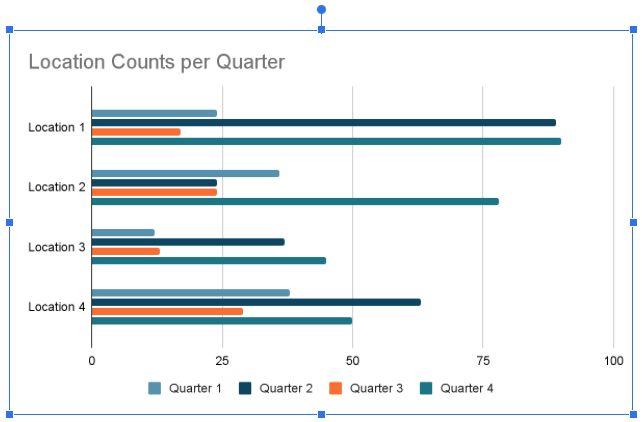
You can work with the data and the chart in Google Sheets as if you created it there initially. For instance, you may want to add another series to a bar graph or more pieces to a pie chart.
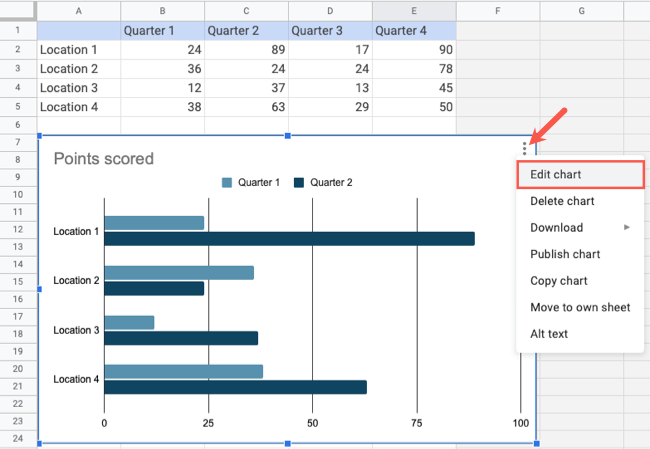
Use the area in the spreadsheet to edit and add data. To include new columns or rows in the chart, double-click the chart or select the three-dot menu on the top right and pick "Edit Chart."
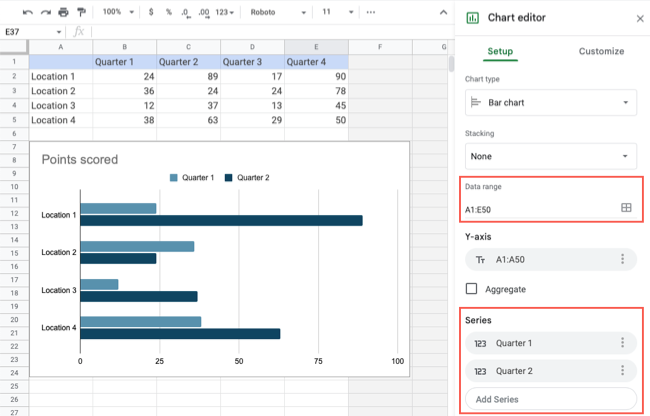
When the Chart Editor sidebar opens, go to the Setup tab. You can adjust the cells in the Data Range field as needed. Then, use the Series section to include the additional series in your chart.
Customize the Chart Elements and Appearance
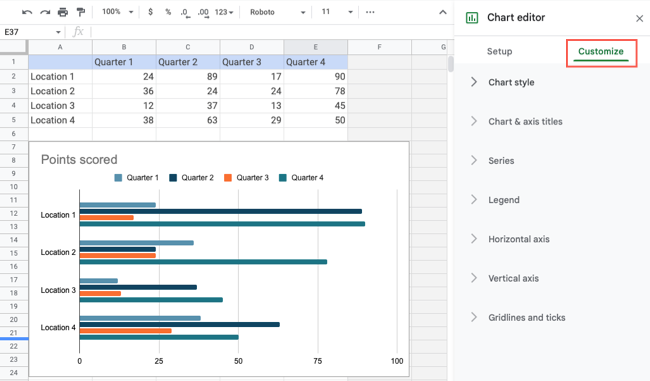
You may want to change the chart's colors, add a title, or display gridlines. Open the Chart Editor sidebar and select the Customize tab.
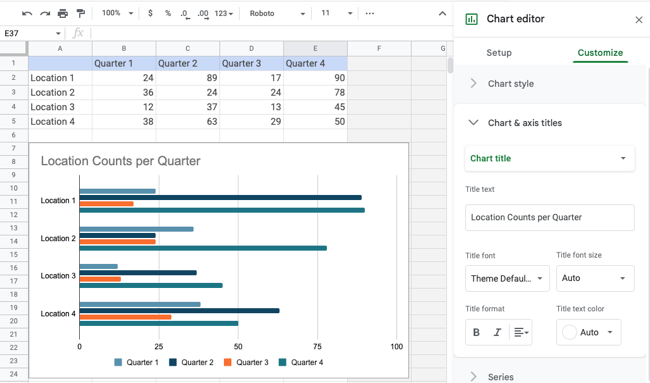
You can then expand each of the sections to customize your graph. Use the Chart Style area to adjust the colors, Chart & Axis Titles section to change the title and font, and the Gridlines and Ticks section to change those items.
Your changes are saved automatically like any other Google app document.
Update the Chart in Google Docs
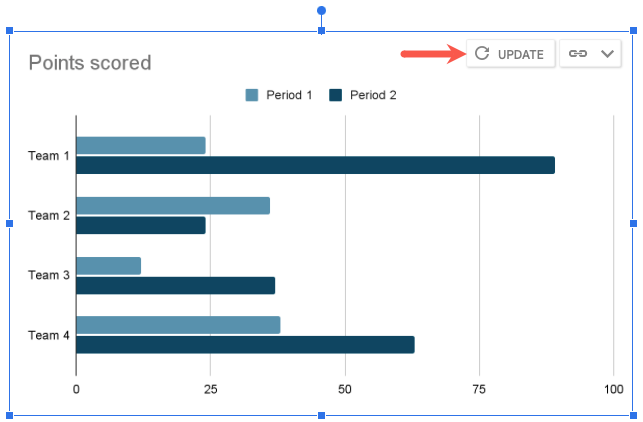
When you finish updating your chart in Google Sheets, return to your Google Docs document. You'll see an Update button on the top right of the graph.
Click "Update" to display the changes you made to the chart in Google Sheets.
Moving forward, you can make additional updates to your chart as needed. Select the arrow on the top right of the chart and pick "Open Source." Make your changes in Google Sheets as you did initially, return to Google Docs, and click "Update" on the chart.
Inserting a chart in Google Docs is an excellent way to show a visual for the data you're explaining. For more, check out how to add flowcharts and diagrams or how to embed a Google Forms response chart in Google Docs.

