Quick Links
Sometimes when you use applications every day, new features can go unnoticed. So that you're up to speed with useful tools for your spreadsheets, take a look at these Microsoft Excel features you may have missed.
1. Sparklines for Quick Little Graphs
While you can create many different types of charts and graphs in Excel, the sparkline option is one you might look past. With it, you can insert a useful graph into a single cell without distracting from the data.
Select the cell where you want to add the sparkline. Head to the Insert tab and choose a Line, Column, or Win/Loss graph, depending on the style you want, in the Sparklines section of the ribbon.
In the pop-up window, enter the cell range or select it on your sheet to populate the Data Range box. Confirm or change the entry in the Location Range box for the placement of the sparkline. Click "OK."
You'll then have a nifty little graph in an individual cell to quickly show a visual of your data without all the fluff.
2. Data Validation for Eliminating Incorrect Entries
When you create a sheet for others to fill out or collaborate on a spreadsheet, you can end up with the wrong data in the wrong places. Using data validation, you can ensure that the information everyone enters is what belongs.
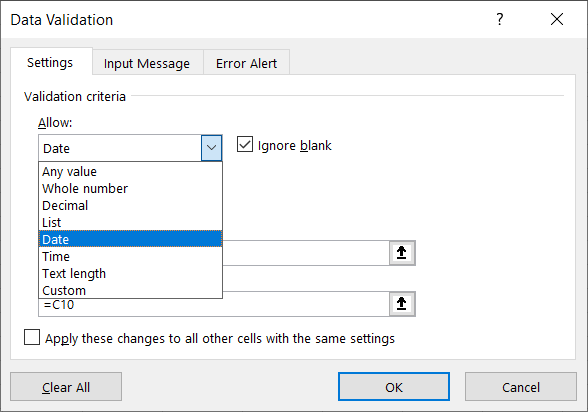
Select the cell where you want to add the validation. Go to the Data tab and click the Data Validation button in the Data Tools section of the ribbon or use the drop-down arrow to select that option.
When the box opens, pick the type of validation you want to use. You can select from text, date, time, whole number, decimal, list, or a custom data type. Complete the remaining fields per the type of data you pick.
Optionally, you can use the Input Message and Error Alert tabs to customize the instruction or error message. Click "OK" when you finish.
Moving forward, when someone adds data to that cell, they'll need to enter the data Excel expects per the validation. If they don't, they'll receive an error.
The data validation feature is a terrific way to create drop-down lists in your sheet for data entry as well.
3. Status Bar to See (and Copy) Calculations Without Formulas
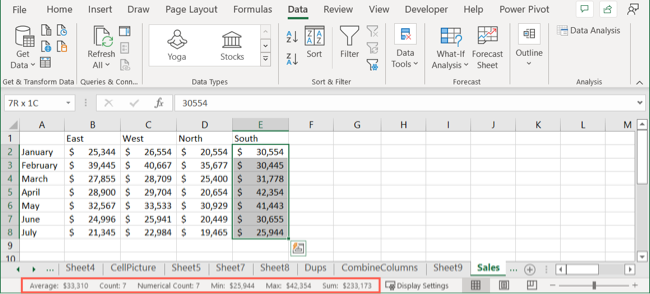
You might want to do a quick calculation, like sum or average a few numbers, but don't necessarily need the formula added to your sheet. Using the Status Bar, you can see calculations in a fast and easy way.
Select the cells containing the values you want to calculate. Then, gaze down at the Status Bar. You'll see Sum, Average, Minimum, Maximum, and Count.
To adjust the calculations that display in the Status Bar, right-click it and select those you want to place checkmarks next to them.
For Windows users, you can also copy a value directly from the Status Bar. Just select the one you want, and it'll be placed on your clipboard. You can then pop it into your sheet or paste it into another application.
4. Flash Fill for Filling Cells
If you have a lot of data to fill, the Flash Fill feature can help you do it by recognizing patterns. For instance, you may have a list of first and last names in a single column that you want to split into two columns. By entering just one piece of data, Flash Fill can fill the rest.
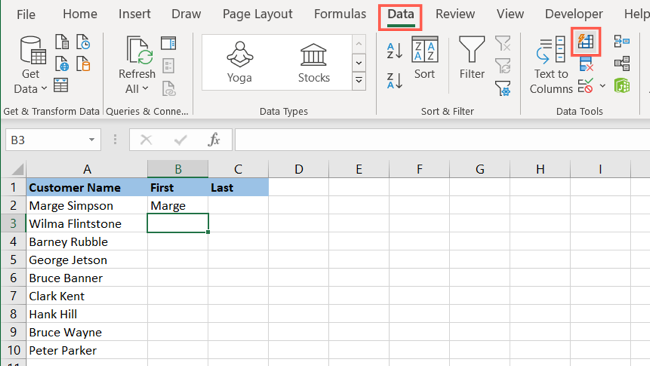
Add a piece of data into a cell. For our example, we'll enter the first name. Then, go to the Data tab and click the Flash Fill button in the Data Tools section of the ribbon.
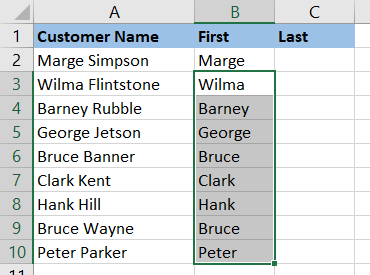
You should see Excel fill in the rest of the cells with those first names. You can do the same for the last name. Enter one into the top cell and press the Flash Fill button. Boom, one and done!
5. Remove Duplicates With a Click
Duplicates happen. This is especially true if you import data into Excel from another source. You might need to take time to clean up repeating data. In Excel, you can remove duplicates in just seconds.
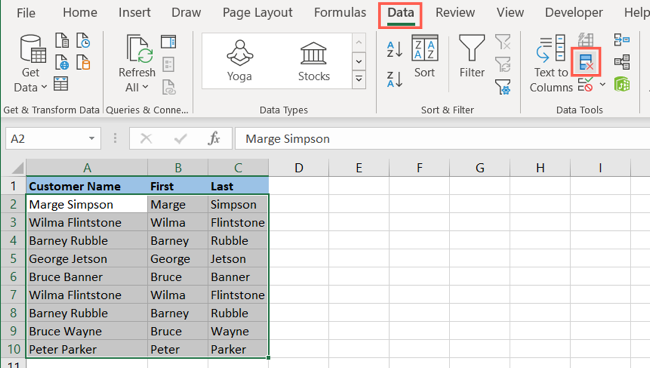
Select the data you want to evaluate for duplicates. Go to the Data tab and click the Remove Duplicates button in the Data Tools section of the ribbon.
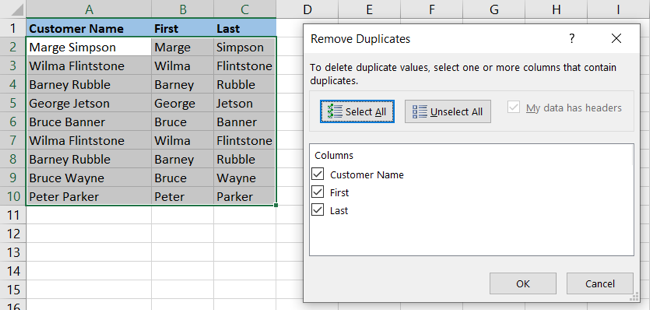
In the box that opens, confirm the columns that you want to check and click "OK."
You'll then see your duplicates vanish with a message letting you know how many were removed.
6. Watch Window for Fast Formula Results
If you have a large workbook with many sheets and tons of data, the Watch Window helps you keep an eye on your formulas. Rather than searching for those changing results throughout your spreadsheets and data, just add the formula to the tool and see the results quickly.
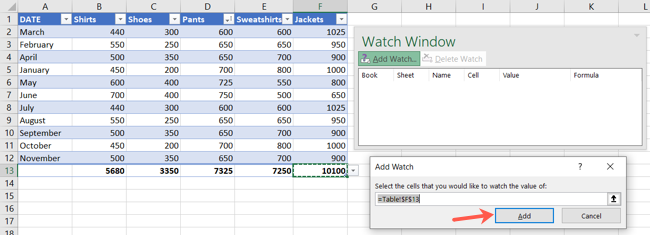
Select a cell containing the formula you want to watch. Go to the Formulas tab and select "Watch Window" in the Formula Auditing section of the ribbon.
Click "Add Watch" to add a formula to the list.
Confirm the cell selected is correct and click "Add."
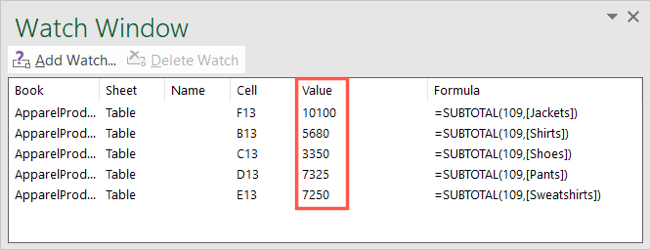
Now you can open the Watch Window from the Formulas tab anytime to see the changing results of your formulas without hunting them down.
7. Analyze Data Without the Work
Microsoft Excel provides a handy feature for automatically analyzing your data. Appropriately named, the Analyze Data feature can save you time when you need a fast analysis.
Select the sheet you want to work with and head to the Home tab. Click "Analyze Data" in the Analysis section of the ribbon.
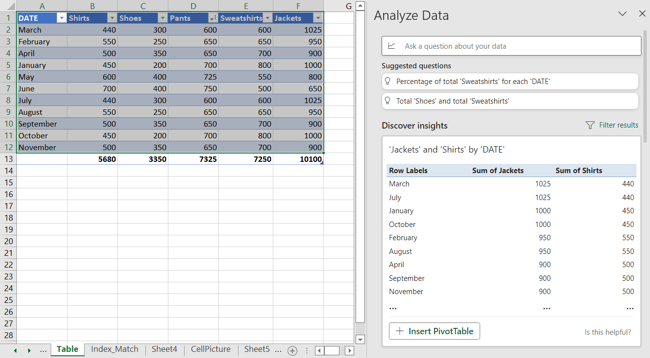
You'll see a sidebar open on the right allowing you to ask questions about your data, discover insights, see frequencies and patterns, and insert items like charts and pivot tables.
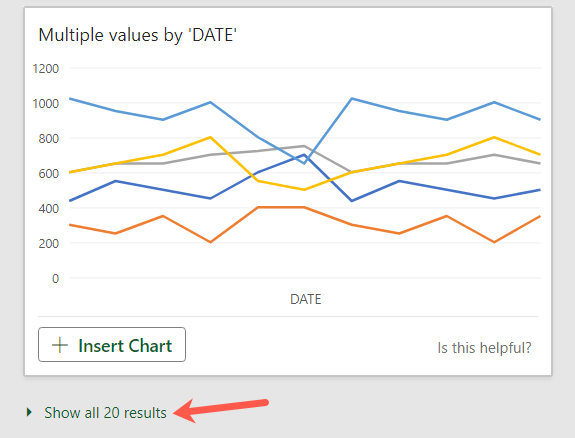
Be sure to scroll to the bottom of the sidebar and click the link to see all available analysis results for your data.
Hopefully these Excel features are some that you'll start using to save time, reduce errors, and keep up with your evolving data. If you want to continue in learning what all Excel is capable of, be sure to check out our guide to basic Excel functions everyone should know.


