Quick Links
A chart or graph is a terrific way to show a snapshot of your data. So when you couple a chart with another visual tool like Google Slides, you can create the perfect presentation of data to your audience.
You can certainly make a graph in Google Sheets and then insert it into your Google Slides presentation. But you can also do the reverse and start the chart from Slides. Here's how to create a graph in Google Slides.
Create a Graph in Google Slides
Visit Google Slides, sign in, and open your presentation. Go to the slide where you want to insert the chart. Because the graph will cover the entire slide by default, you may want to start with a blank slide. You can then resize and move the chart afterward as needed.
Open the Insert menu, move to Chart, and choose the type you want to use from the pop-out menu. You can use the most common kinds of graphs like bar, column, line, and pie.

You'll then see a default chart with sample data pop onto your slide. You'll also notice a brief message at the bottom letting you know that you can edit the chart in Google Sheets. Click the Edit in Sheets link in the message to go directly to the chart in Google Sheets.
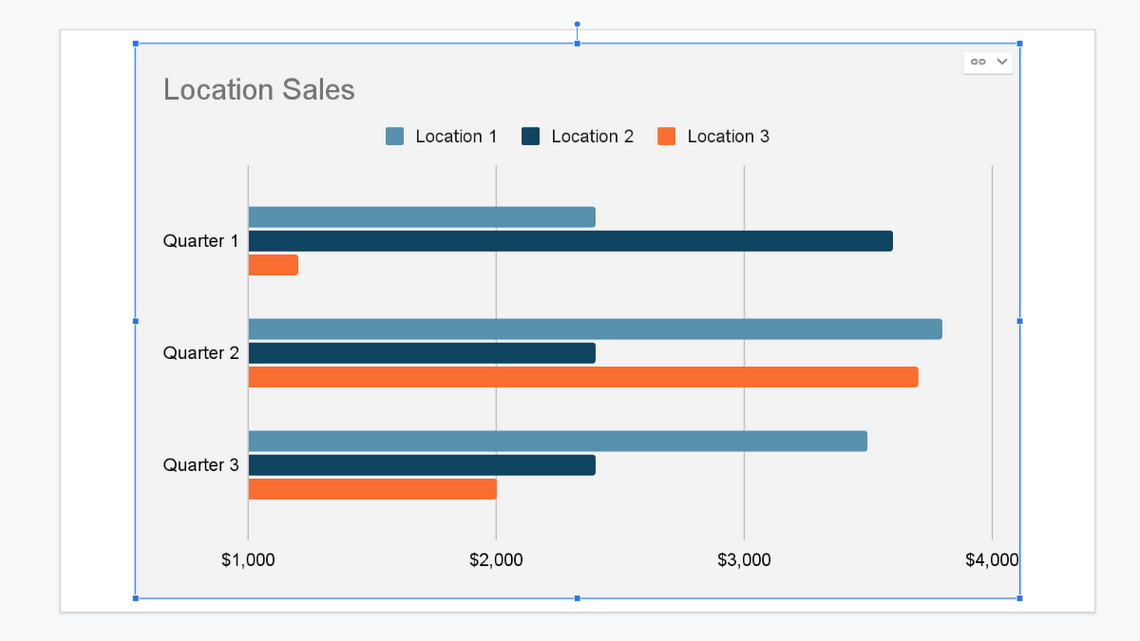
If the message vanishes before you can click the link, don't worry. Select the chart and then click the arrow on the top right of it. Pick "Open Source" and Google Sheets will open in a new browser tab right to the chart and its data.
Edit the Chart and Data in Google Sheets
You can use the sample data for the graph if it fits your purpose. If not, simply use the cells above the chart in the Google Sheets to add your own data.
To adjust what displays on the chart, click the three dots on the top right of it and pick "Edit Chart." This opens the Chart Editor sidebar for you to adjust the axes, series, and other elements on the Setup tab.
To customize the appearance of the chart, select the Customize tab in the sidebar. You can expand the categories depending on your graph type to change things like the chart style, legend, and series.
When you finish setting up the data, adjusting the chart, and customizing the appearance in Google Sheets, return to the Google Slides tab in your browser.
Update the Graph in Google Slides
Back to your slide, you'll see an Update button appear on the graph. Click this to apply the changes you made to the chart and data in Google Sheets.
Moving forward, you can update the chart data or the chart itself by opening the corresponding Google Sheet. Again, you can do this by clicking the arrow on the top right of the chart in Google Slides and picking "Open Source."
But you can also visit Google Sheets directly or Google Drive. The name of the spreadsheet will be the same name as your Slides presentation plus the chart type.
If you want to convert the graph to a static image, you can simply unlink it from the Google Sheets source. Click the arrow on the top right of the chart and pick "Unlink."
Just note that you cannot update the chart or its data using Google Sheets if you unlink it. It will appear as a static image on your slide.
Adding a chart to your Google Slides presentation might be just the visual you need to enhance the slideshow or show the exact data necessary.
For other types of visuals for your slideshow, take a look at how to add videos and customize the playback or how to draw on Google Slides.