Quick Links
Key Takeaways
- High GPU temperatures can reduce performance and even cause system shutdowns. Monitoring GPU temperature is crucial to ensure it stays within acceptable ranges.
- Windows Task Manager, NVIDIA GeForce Experience, and AMD Radeon Software all provide built-in temperature monitoring for GPUs, allowing users to track their temperature and other performance statistics.
- Third-party tools like MSI Afterburner, EVGA Precision X1, and HWiNFO64 offer additional features such as overclocking and logging temperature data, giving users more customization options for monitoring and optimizing GPU performance.
High temperatures reduce the performance of your GPU and may even cause your system to shut down. There are numerous ways to monitor your GPU's temperature — find out more about some different options here.
Why Monitor GPU Temperature?
While your GPU works, it generates heat. If it gets too hot, your GPU may experience thermal throttling, which will reduce your performance dramatically. A hot GPU also places greater wear and tear on the fans in your GPU cooler, making them more prone to failure. Should a GPU reach a critical temperature, it may even trigger a shutdown to protect itself from damage.
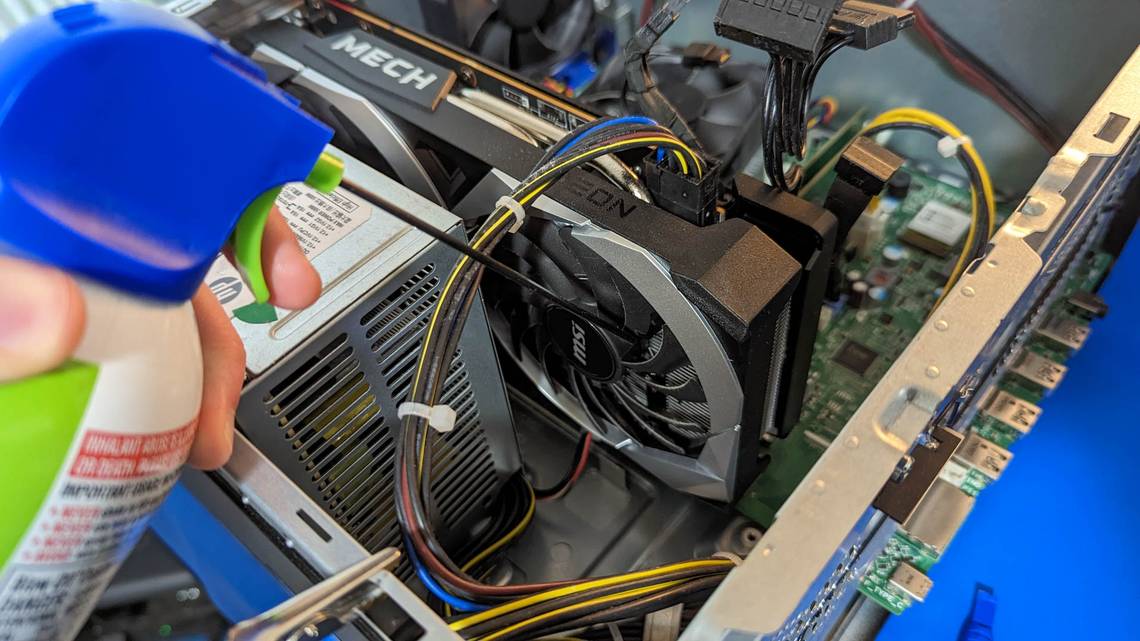
Fortunately, a GPU that runs too hot is often fixable. The solution could be as simple as giving your computer a thorough cleaning or figuring out what cooling and airflow setup is optimal for your PC, but you have to notice the issue first. Monitor your GPU temperatures to ensure that temperatures are staying within acceptable ranges.
Many of the programs in this article include features that can overclock your GPU. Overclocking can make thermal problems worse and cause damage to your hardware. Avoid those features unless you've read about how to overclock safely.
Windows Task Manager to Monitor GPU Temperature
Windows 11 has the ability to monitor your GPU temperature built-in, and Windows 10 has had it since the May 2020 update. The temperature monitor is found in Task Manager.
To open it, hit Ctrl+Shift+Esc, and then click "More details" if it is present at the bottom left.

Click on the performance tab at the top. Scroll down on the left-hand side until you see "GPU", and then click that. The temperature is displayed at the bottom of the GPU page.

NVIDIA GeForce Experience
GeForce Experience is the software NVIDIA provides to monitor your GPU's temperature. Launch it from your Start menu to get started.
To find the temperature monitor, you need to access the in-game overlay settings. Click the triangular icon in the top right.

On the window that pops up, click "Performance."

You'll see a bunch of statistics about your GPU here, including the GPU clock, temperature, fan speed, and power draw.

You can customize how this is information is displayed by clicking the gear in the bottom right. It even has an option for an in-application overlay, so you can keep an eye on your temperatures while you're gaming.
AMD Radeon Software
AMD's tool for monitoring your GPU is called Radeon Software. You can launch it from your Start menu.
To access the temperature monitor for the GPU, click on the "Performance" tab at the top left of the Radeon Software home screen.
The GPU temperature is displayed in the bottom left.
AMD's monitoring software includes the ability to log data about your GPU into a CSV file. It is a convenient feature if you want to monitor your GPU temperature for extended periods of time, or if you want to compare how other GPU stats, like GPU utilization, correspond to GPU temperature.
Third-Party GPU Temperature Monitoring Tools
MSI Afterburner
MSI Afterburner is a popular choice among enthusiasts to monitor GPU performance because it works with almost all GPUs and allows for overclocking and other customization. Like the tools from NVIDIA and AMD, it can display the information while you're in-game. It also provides the ability to log performance statistics, like AMD's Radeon Software.
The temperature monitor is found directly on the main page.

EVGA Precision X1
EVGA's Precision X1 has the same basic features as Afterburner and Radeon Software, except that it exclusively supports NVIDIA GPUs. Like Afterburner, the temperature indicator is in the middle of the first page, and it supports logging temperature data to a file.

HWiNFO64
HWiNFO64 goes above and beyond monitoring your GPU's temperature, and has a different design from Precision X1 or Afterburner. It provides data about every component in your system in real time, and supports logging any metrics it can display. When you launch the program, you'll be asked if you want to run "Summary-only" or "Sensors-only." Click "Sensors-only" and then hit run.

Look for a section titled "GPU[#]:" — it should have the name of your GPU displayed to the right. Immediately under that will be your GPU temperature. If you have a CPU with integrated graphics (like an AMD APU or one of Intel's CPUs with an iGPU) and a dedicated GPU, there might be multiple GPUs displayed.

These are only a few of the options available. All Add-In Board (AIB) GPU manufacturers have their own software comparable to EVGA's Precision X1 and MSI's Afterburner. Many other companies that make hardware aimed at gamers also offer monitoring software that can track your GPU's temperature.
Most of these solutions offer the same set of features, so make your choice based on whichever you find the easiest to use and that you like the most.