Quick Links
Linux memory usage can be difficult to interpret and hard to understand. With smem it's easy to find out what memory a process is using, and which processes are using the most.
Memory Usage
Linux gives you many ways to check what's happening with your computer's RAM. The problem is, memory management is a complicated challenge for your operating system. It has to juggle physical RAM, virtual RAM in the form of swap space, and the demands of the different types of processes that are running at any one time.
Processes consume RAM as they load themselves into memory. They then request more RAM so that they have space to perform whatever tasks it is they're designed to do. Some processes hardly impact RAM, others are very memory-hungry.
The kernel and the rest of the operating system, your desktop environment, and every application or command line session you run are all clamoring for a portion of the finite amount of RAM installed in your computer. Some processes spawn other processes. Some processes share RAM with other processes.
Trying to decipher all of this and to come up with a simple answer to the question "How much RAM is this program or process using?" can be a surprising challenge. Granularity is great and has its place but, equally, information overkill can be an impediment.
For example, using
cat
to peek into the /proc/meminfo pseudo filesystem returned 50 lines of output on the machine used to research this article. Where do you start?
cat /proc/meminfo
And some Linux utilities give different answers. On our test machine, we had an instance of less running, which had a process ID of 2183.
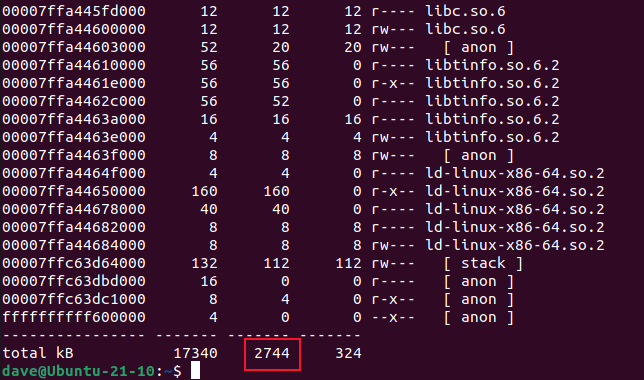
We can use the pmap utility with the -x (extended) option to get a full picture of the memory usage of a process. We'll use it with the process ID of our instance of less:
pmap -x 2183
At the bottom of the output, we get a total for the Resident Set Size, which is the amount of main RAM being used.
We then used the ps utility with the -o (output) option, selected the RSS column, and passed it the process ID of the same instance of less:
ps -o rss 2183
We get a different result. This is a design decision on the part of the ps authors. This is from the ps man page:
The SIZE and RSS fields don't count some parts of a process including the page tables, kernel stack, struct thread_info, and struct task_struct. This is usually at least 20 KiB of memory that is always resident. SIZE is the virtual size of the process (code+data+stack).
The authors of other utilities have their own views on how to measure RAM usage.
The RSS, the USS, and the PSS
The Resident Set Size (RSS) is the amount of RAM allocated to a process, excluding swap space, but including any RAM required by shared libraries that the process is using.
RSS almost always over-reports RAM usage. If two or more processes use one or more shared libraries, RSS will simply add the RAM usage of each library to its count of RAM usage for each of those processes. As well as inaccuracy, there's a certain irony to this. Shared libraries mean each process doesn't need to load its own private instance of a library. If the library is already in memory it'll share that one---and reduce the RAM overhead.
The Proportional Set Size tries to address this by dividing the amount of shared memory amongst the processes that are sharing it. If there are four processes sharing some memory, PSS reports that 25% of the shared RAM is used by each of those processes. This is an approximation but it more closely resembles what's going on than the picture that RSS paints.
The Unique Set Size is the amount of RAM that is being used exclusively by a process whether it is directly consumed by the process, or used by libraries that are solely in use by the process. Again, it ignores swap space. It's only interested in genuine, physical RAM.
USS and PSS are terms and concepts that were proposed by Matt Mackall, the author of smem.
The smem Utility
The smem utility reports on memory used by processes, users, mapping, or system-wide. On all distributions we tested, it required installing. To install it on Ubuntu, use this command:
sudo apt install smem
To install smem on Fedora you need to type:
sudo dnf install smem
To install smem on Manjaro use:
sudo pacman -Sy smem
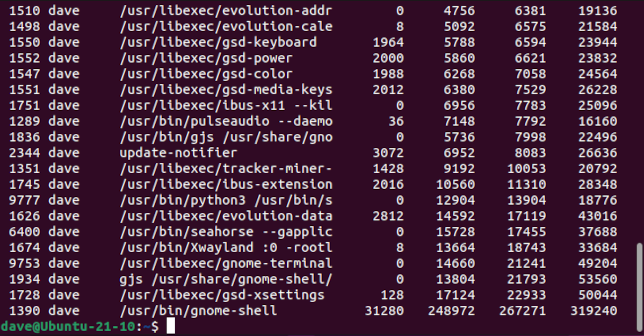
Using smem with no options gives you a list of the processes that are using RAM.
smem
A table of information is displayed in the terminal window.
The columns are:
- PID: The process ID of the process that's using the memory.
- User: The username of the user who owns the process.
- Command: The command line that launched the process.
- Swap: How much swap space the process is using.
- USS: The Unique Set Size.
- PSS: The Proportional Set Size.
- RSS: The Resident Set Size.
To see the sizes expressed as percentages, use the -p (percentage) option.
smem -p
The sizes in bytes have been replaced with percentages.
To see the figures rendered in a more human-friendly form, use the -k (abbreviate) option. This shrinks the figures and adds unit indicators.
smem -k
Instead of raw bytes, the sizes are shown in megabytes, gigabytes, and so on.
To add a totals line, use the -t (totals) option.
smem -k -t
The last line of the output shows totals for each column.
Refining the Report
You can ask smem to report on the memory usage by users, mapping (libraries), or system-wide. To filter the output by user use the -u (user) option. Note that if you want to see more than just your own usage, you'll need to run smem with sudo .
smem -u
sudo smem -u
As you can see, the output gets bent out of shape for user names longer than eight characters.
To see the usage mapped to the libraries that are in use, regardless of which processes are using the libraries, nor which users own those processes, use the -m (mapping) option.
smem -m -k -t
We also asked for human-readable values and a total.
To see the system-wide memory usage use the -w (system-wide) option.
smem -w -k -t
Reporting on a Single Program
With a little bit of command-line magic, we can report on a single program and all of its sub-processes. We'll pipe the output from smem into tail and ask tail to only show the last line. We'll tell smem to use human-readable values and to provide a total. The total will be the last line, and that's the line tail will display for us.
We'll use the -c (columns) option with smem and tell it which columns we want to be included in our output. We'll restrict this to the Proportional Set Size column. The -P (process filter) option allows us to give a search string to smem . Only matching lines of output will be included.
smem -c pss -P firefox -k -t | tail -n 1
That's a quick and neat way to find out the RAM consumption of a program and its child processes.
Generating Graphs
You can pass the --pie or --bar options to have smem generate graphs. It has to be said that with too many categories the graphs quickly become unintelligible, but they can be useful for a quick visual overview.
The command format is:
smem --pie name -s uss
The pie chart appears in its own viewer window.
To see other plots, use pss or rss instead of uss. To see a bar graph, use --bar instead of --pie.
For this to work you'll need to have Python installed, along with the matplotlib library. These were already installed on the Ubuntu, Fedora, and Manjaro distributions we tested.
Good Things Come In Small Packages
The smem utility has a few more tricks up its sleeve, and you're encouraged to check out its man page. Its main repertoire is what we've outlined here, and it's a great little tool to have in your CLI toolbox.


