Quick Links
Enforcement of broadband caps is on the rise. Whether you’ve received a warning letter from your ISP or you just curious and want to keep an eye on things, this tutorial will show you how you can monitor, log, and save your bandwidth usage with Tomato.
What You’ll Need
For this tutorial you’ll need the following things:
- A router running the aftermarket firmware, Tomato.
- A computer to access the Tomato web-based GUI from.
- A network share if you wish to save your logs off the router (recommended).
If you’re not already running Tomato, check out our guide to it here to get it up and running on your router.
Enabling Bandwidth Monitoring

The very first order of business is turning on the monitoring functionality in Tomato. Visit your router’s GUI (typically available from within your LAN at 192.168.1.1) and navigate to Administration –> Bandwidth Monitoring. Check the box next to Enable.
Beneath the Enable box you’ll find a set of options including save history location, save frequency, and the designation of the first day of the month.
Let’s take a look at the Save History Location. For those interested in storing logs long term there are several options in the Saving History Location pull down menu. For most routers you should see RAM (temporary), NVRAM, JFFS2, CIFS1, CIFS2, and Custom Path. What are these things and what are the positives and negatives to using them?

RAM (temporary): The positive to using the RAM is that it’s quick and you don’t have to configure anything. The downside is that you lose all your data when the router shuts down or crashes. As the log gets too big the tail end of the log is cut off.
NVRAM: The Non-volatile Random-Access Memory aboard the router. This is simply RAM that retains the data when the power is off. It’s marginally better than plain old RAM because of this feature but not by much. You get the benefit of the RAM with a lowered risk of data loss.
JFFS2: The Journaling Flash File System is a portion of NVRAM specifically formatted for file writing. It’s still not very big but for month-by-month logging it should be adequate.The problem with both the NVRAM/JFFS2 is that neither system was designed for frequent writing. There’s no sense prematurely wearing out a component in your router when there are alternatives, like CIFS.
CIFS 1/2: Tomato has a small CIFS (Common Internet File System) client built in. Essentially this allows Tomato to access a Samba/Windows Share share and mount it like a drive. If you want to archive your logs without worrying about running out of space this is your best option. It requires minimal configuration which we’ll delve into in the next section.
Custom Path: This simply allows you to create a custom directory within the JFFS2 for your log files. Not really necessary unless you’re actively using the JFFS2 for something and you’d really like a custom directory to keep things neat and tidy.
As for the other settings you’ll find in the Bandwidth Monitoring:
Save Frequency: Denotes how often Tomato will save the logs. If you’re using the RAM this setting doesn’t really matter. If you’re using any of the storage options like JFFS2/CIFS, this allows you to set how often the logs are saved. The higher your save frequency the less chance you’ll lose data because of a power out or some other router interruption.
Save On Shutdown: Just like it sounds, if you (or an application) sends the shut down signal to Tomato it will save the logs first.
Create New File: Wipes your current file and creates a new one. Sometimes when you switch save locations (such as moving from RAM to CIFS) it is necessary to create a new file in order for the new files to save properly.
Create Backups: Again, just like it sounds. Will generate backup reports in your specified download directory. In addition to the regular log saves you’ll have matching files with a .BAK extension.
First Day of the Month: The default of 1 should be fine unless your ISP logs from the middle of the month or something odd like that.
If you’ve opted to store your files on a network share via CIFS (and we highly recommend you do) you’ll need to set up the CIFS client before you go any further.
Enabling Tomato’s CIFS Client

In order to save to a network share you need to enable the CIFS client. Navigate to Administration – > CIFS Client.
From within the CIFS client menu check the Enable box under /cifs 1. Fill in the following information:
UNC: The IP address of your network share source and the directory, i.e. \\192.168.1.120\RouterLogs—do not use the name of the source on the network, use the IP.
Username/Password: You can use an existing account that has access to the network share or create a new account (on the host machine) just for the router to use. Either way you need a login and a password. Some people report success using the Guest account and just putting in a string of random key presses for the password (the CIFS client insists on there being a password in the password slot). The official Tomato documentation recommends against this.
Domain: Can usually be left blank; if computer is on an actual Domain it may need to be filled in with the appropriate domain name.
Execute When Mounted: This allows you to execute scripts on the router’s Linux OS when a remote drive is mounted. For our purposes leave it blank.
When you’ve filled in all your information click Save at the bottom. It should take a moment or two to mount (perhaps even upwards of 5 minutes) but then you should see the drive data listed in the Total / Free Size slot. If it fails to mount double check your password, make sure that the account you’re using has access to that directory (and can write to it), and, if you run into a wall, create a whole new share directory. We had an issue with Windows Home Server not wanting to grant access to a directory that was already part of the WHS share structure (the //Server/Public/ folder) so we made a brand new root share //Server/RouterLogs and all our CIFS creation woes vanished.
Once you’ve created the CIFS and it has been successfully mounted, go back to the Bandwidth Monitoring section and change the save location to CIFS 1.
Real Time Monitoring with Tomato

Now that we have the logging and the saving of those logs on lock down, let’s take a look at how you can use Tomato to monitor your bandwidth in real time and quickly look back over how much data you’ve used in the previous day, week, and month.
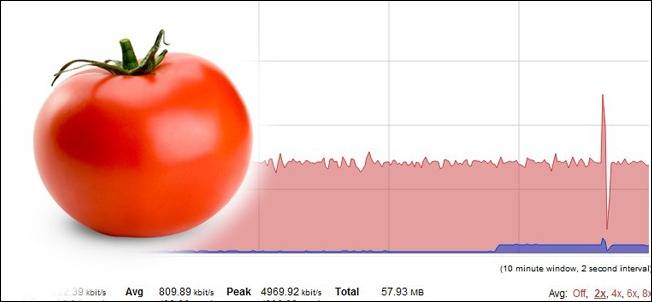
Navigate to Bandwidth in the left hand menu within the Tomato GUI. The default view is real time and should look like the screenshot above. You can look at all the traffic at once or you can look at just a slice of it by clicking the tabs along the top of the graph. Here’s what those tabs represent:
WAN (vlan1): This is the traffic coming into and going out of the WAN/Broadband port on your router. If your router is hooked directly to your data modem this is the best way to see exactly how much you’re downloading and uploading.
WL (eth1): This is your Wi-Fi traffic. Here you can see all the data activity happening inside your network on the Wi-Fi band. Generally you’ll only check this out if you’re trying to trouble shoot a Wi-FI device or if you suspect somebody is using your Wi-Fi.
br0: This is the bridge connection between the WAN and LAN ports. Watching this shows you the total traffic over the router including the Wi-Fi traffic, hardwire Ethernet connections, and out to the greater internet. This tab offers such sweeping view it’s hard to take in.
eth0: This tab shows all the hardwire traffic which includes the local ports and the WAN port with the internet traffic.
vlan0: Not actually a LAN, as it were, despite the “lan” portion of the name. Shows the hardwired ports, internet traffic, and internal traffic. If you want to see both the internet traffic (the data you’re uploading and downloading) as well as the data being moved around the internal network at the same time, use this view. It’s handy for seeing both that a large volume of data is coming in and where it’s going.

The above diagram highlights the internal setup and naming structure for a line of popular Linksys routers and should help you better visualize what is going on with each monitoring tab.
In addition to real-time monitoring you can also look at the prior day, week, and month. These views are much less colorful and simply give you the numbers in your preferred scale (KB, MB, or GB).
Now that we’re finished with the tutorial we’ve got a router that actively logs our bandwidth consumption, displays our usage in real time, and archives the logs to a network share for backup and further analysis. Have a question or a router trick? Let’s hear about it in the comments.