Quick Links
If you take advantage of Microsoft Excel's charts for helpful visual displays of your data, check out the People Graph option to create a simple depiction of the number of people or items you have logged in your spreadsheet.
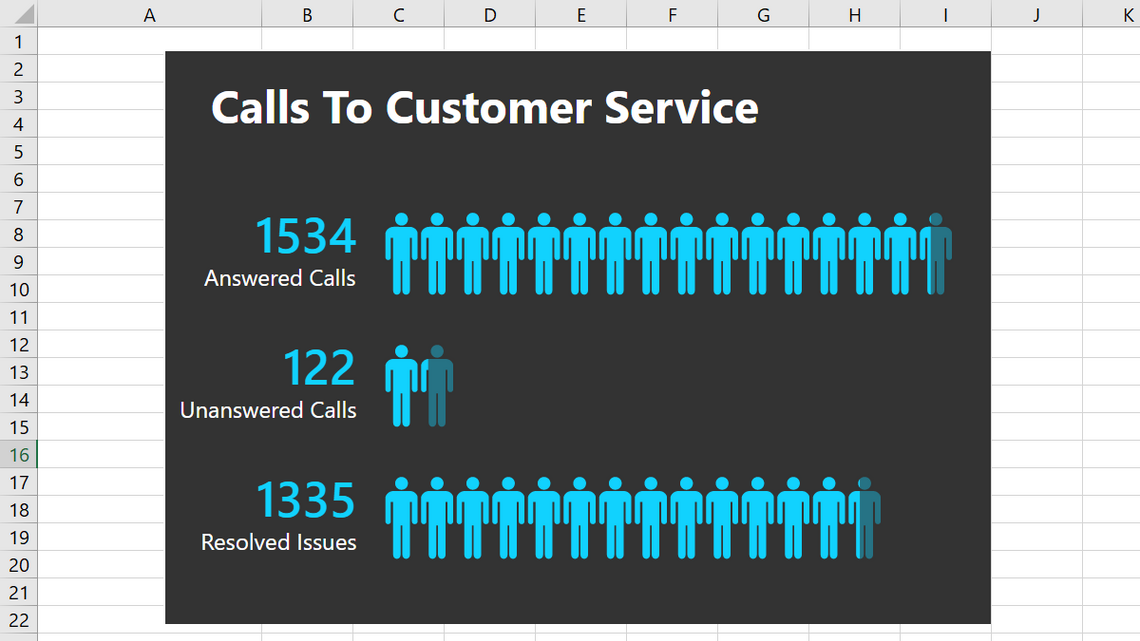
You can display things like the number of visitors to your website, downloads of your app, sign-ups for your event, calls to your support center, and much more.
Add the People Graph Add-In to Excel
People Graph is an add-in developed by Microsoft, and there's already a button for it in your Excel ribbon. But before you can use it, you'll have to trust the add-in to install it.
Open the Insert tab in Excel and look for the Add-Ins group. Click the button for People Graph.

You'll see a pop-up window with a link to "See Details." This takes you to the add-in on the Office Store website, where you can read an overview, reviews, and other details. Click "Trust This Add-In" to get started.

Once the add-in is installed in Excel, you can click the button on the Insert tab to use the feature when you need it.
Insert a People Graph
Whenever you hit the People Graph button in the ribbon, you'll see a sample graph. Click the Data icon that looks like a small grid.

Optionally, you can enter your graph Title before selecting your data, or you can just head back to this spot to add the title later.
Click "Select Your Data," and then drag through the cells that you want to use. Currently, you must use two columns of data, but you can have multiple rows.

Then, click "Create" on the People Graph screen.

Customize Your People Graph
After you insert your People Graph in Microsoft Excel, you can customize it. Click the gear icon to open the settings. You can then move through the three settings for type, theme, and shape.

You can currently pick from three graph types. Each has a slightly different layout and appearance. Click "Type," and then choose one on the right side.

Next, you can select a theme that changes the background and colors of the graph. Click "Theme," and choose one of the seven options.

Finally, you can use a different shape. So if your data is better represented by a shape other than people, you can choose the best fit. Click "Shape" and pick from the 16 options.

You can select and drag your People Graph wherever you want it on your spreadsheet. And if you edit the data on which the graph is based, Excel will update the graph automatically.

Refresh, Delete, or Select the People Graph
On the top right of your People Graph, you'll see an arrow (Windows) or an Info icon (Mac). When you click, you'll see several actions.
Choose "Reload" to refresh the graph, "Delete" to remove it, and "Select" to select the graph if you want to move it. You also have options to get support, attach a debugger, and view the security info.

If you're looking for a simple way to visually display data, especially if it includes a number of people like customers, clients, or contacts, try out the People Graph in Microsoft Excel. And for another helpful type of chart, take a look at how to create a tally graph in Excel.