Microsoft's SQL Server has a tool called Profiler that you can use to monitor every SQL query that hits the database. This is extremely useful for programmers as well as database administrators to troubleshoot the exact queries generated by an application. Having switched to using MySQL on a frequent basis, this was one of the first things I wanted to figure out how to do. How else can you see the actual SQL code generated by Wordpress or phpBB? The first thing we'll need to do is turn on logging of queries in MySQL. Be warned that this should only be done in development... it really slows things down to log every single query to a file. Find and open your MySQL configuration file, usually /etc/mysql/my.cnf on Ubuntu. Look for the section that says "Logging and Replication"
#
# * Logging and Replication
#
# Both location gets rotated by the cronjob.
# Be aware that this log type is a performance killer.
log = /var/log/mysql/mysql.log
Just uncomment the "log" variable to turn on logging. Restart MySQL with this command:
sudo /etc/init.d/mysql restart
Now we're ready to start monitoring the queries as they come in. Open up a new terminal and run this command to scroll the log file, adjusting the path if necessary.
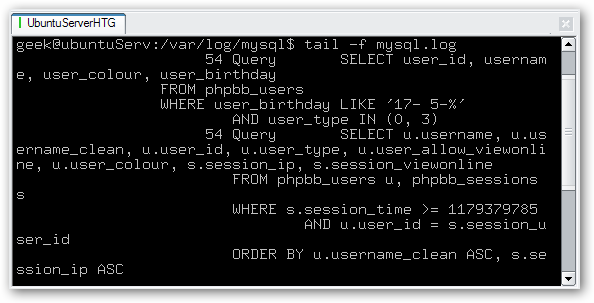
tail -f /var/log/mysql/mysql.log
Now run your application. You'll see the database queries start flying by in your terminal window. (make sure you have scrolling and history enabled on the terminal) I'm impressed, phpbb3 has fairly tight, optimized SQL code. Wordpress, on the other hand, is very inefficient.