Quick Links
Brightness and Contrast tools are for beginners! Ever wondered what graphics programs offer advanced users to ensure their photographs have a great value range? Read on to learn about Levels, Curves, and Histograms in three major programs.
Curves and Levels are not as intuitive as the more basic Brightness and Contrast sliders Photoshop, GIMP, and Paint.NET all share. However, they offer a great deal more control over images that professionals and skilled image editors will demand. Combine these tools with a knowledge of how basic histograms work, and you’ll be well on your way to editing contrast like a pro!
What is a Histogram?


Histograms are confusing looking collections of information, and are not obviously understood unless they are explained. The left is the histogram tool in Photoshop (Window > Histogram), the right is the Histogram tool in the GIMP (Colors > Info >Histogram). Out of the box, Paint.NET does not have a stand alone Histogram tool, but has them built into other tools that we will discuss later.

You can think of a histogram as a sort of simple algebraic mapping of the information in your image. Your horizontal (x axis) represents your value range, from your darkest blacks on your left side, to your lightest whites on your right. Your vertical (y axis) shows the concentration of that value in your image. The higher the peaks, the more of that color is in your image. High peaks on the right side represents high amounts of light values, highlights and whites, while high peaks on the left represents a high concentration of dark, black, low light values.


Histograms can be made for any color channel, or for combinations of those channels, although you might see quite different information depending on which you are looking at. Remember that all photographs are made of image channels, all of which have their own range of values, but can also be combined to create a complete image. Regardless of all that, you can learn a lot of useful information checking out how the values are distributed in your images.
Brightness and Contrast Tools


Brightness and contrast, as we discussed, are easy to understand methods for editing photographs. They give you only basic edits to your value range, clunkily bloating, stretching, and distorting your value range, giving less than perfect control over the parts of your histogram you want to change. Pictured above are the Brightness and Contrast tools for Paint.NET (left) and the GIMP (right).

Ideally, a good, balanced image should have good detail in the lights and darks, as well as a good value range throughout, without a lot of dynamic high peaks in any area. Brightness and contrast tools simply “stretch” the entire range out to create brighter images, leaving gaps in the histogram without bringing out details in either the highlights or darks.
Working with Levels


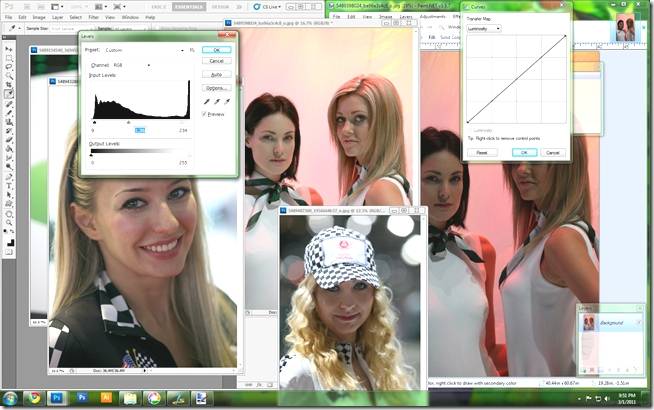
Levels are the superior tool for adjusting histograms, and bringing out rich value ranges in an image. GIMP’s Levels tool (left) and Photoshop’s (right) look very similar. They have two basic sliders, one for Input Levels, and another for Output Levels.


Input levels allow you to adjust your range of values by adjusting three points within the horizontal axis. Moving the “Darks” point will make all of your darks heavier and blacker. Adjusting your “Lights” point will make all of your highlights brighter and lighter. And adjusting the middle point will cause your value range to lean one way or another, either lighter or darker, effectively compressing that part of the old histogram, while stretching out detail in other parts.


Output Levels give you direct control of the Y-Axis of your histogram, and allow you to set a ceiling for how dark your darks can be, and how light your lights can be. Used in combination with adjustments to Input Levels, detail can be coaxed out of even stubborn images.

It is worth noting that Paint.NET’s Levels tool is slightly different than either Photoshop or GIMP. It is no more complicated than either, and a basic understanding of histograms and some patience will allow you to make any adjustment you could make in Photoshop or GIMP.
How to Use Curves


Curves are yet another way to look at adjusting the same color information, with the exception that it is a considerably more complex tool, allowing for fine tuning and microadjustments to images.


On the basic curve, the vertical axis represents the Output Levels, which sort of turns your histogram on its head. In its natural state, the “curves” line represents a 1:1 ratio, or a straight rise/run diagonal line. This means that the darkest parts of the horizontally noted values should have an equal, corresponding value in your vertical axis. What does all this mean? Basically, you have the ability to subtly put a ceiling on your lights and darks, while creating potentially complex adjustments to the other parts of your image.

Drastically different images can be created by distorting curves. Midtones can be made into highlights, darks into lights, highlights into midtones, and all with the same basic set of tools.

For even further complication, curves can be adjusted per channel, like Levels. This allows for an impressive level of customization, allowing graphics power users to coax better, richer information by editing channels independently and together. This can allow you to, perhaps, shift your highlights to be more yellow or gray, while making your shadows more red or blue. Curves can prove a vital set of tools for any photographer, from amateur to seasoned pro.
While the program’s visuals may differ slightly from Photoshop to GIMP to Paint.NET, you can expect the power of these tools to remain the same. Expect some minor differences in the user interface, with the core functionality intact.
Image Credit: All images by Guillaume Boppe, available under Creative Commons.