Yesterday we showed you how to monitor and track your total bandwidth usage, today we're back to show you how to keep tabs on individual applications and how much bandwidth they're gobbling up.
We've received several reader requests, both by email and in the aforementioned post about bandwidth tracking, for a good way to track the data consumption of individual applications. How-To Geek reader Oaken noted that he used NetWorx to track his total bandwidth usage but another application, NetBalancer, to keep tabs on individual applications. We took NetBalancer for a spin and it's a great solution for monitoring bandwidth at the application level. Let's take it for a spin and start monitoring our applications.
Installing and Configuring NetBalancer

Download a copy of NetBalancer here, grab the free version as it is more than satisfactory for our purpose here (you can upgrade easily enough if you want the extra features).
Make sure you don't have anything important downloading at the time you install NetBalancer, it resets your network connection and will dump all your active downloads. Also, during the later part of the installation process (right around the time you see the box in the screenshot above) you'll likely get two driver errors to the effect of "Windows cannot verify the digital signature for the drivers...", go ahead and manually override both errors (we promise nobody's head will explode and no puppies will be harmed). You'll need to reboot either now (or after you've finished configuring the settings) in order for NetBalancer to accurately report bandwidth usage. Without the reboot it lumps nearly all traffic into the nebulous category "Unidentified or Service Traffic" which isn't very helpful.
After NetBalancer finishes installing it will run for the first time, polling all the processes on your machine and compiling a list of them. After a few seconds of grinding and compiling you'll see a screen like this:

Don't worry about squinting at the fine details, we'll be taking a close up look in a moment. For a general overview though, what you should be seeing at this point is all the processes on your computer, their PID, and other identifying information about them like the path to the process executable and the data currently being transmitted.
Depending on the number of network interfaces and virtual machines you have, you may want to take a moment to visit File --> Edit --> Network Adapters and uncheck all the adapters but the one you wish to monitor (or leave them checked if you do heavy work in your VMs).

Another tweak we need to make right out of the gate is to toggle the reporting size units and the processes show. Navigate to Edit --> Settings and then change the Traffic Unit to MB in order to make the graphic display more useful. The second thing you want to do is, while still in the Settings menu, is check Show only online processes. Your computer likely has hundreds of processes, most of which are never going to get online, there's no sense cluttering up the display with all of them. We want to see which apps are connecting to the network and what they are doing.

Once you've done all this configuration (make sure to reboot if you haven't yet) click on the incoming column to sort the processes by incoming data.
Taking a Peek at the Bandwidth Data

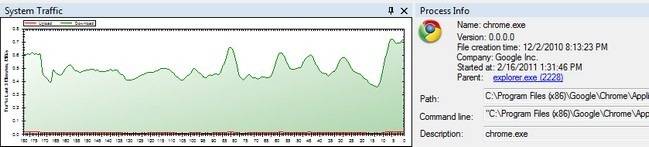
Here we see which application is currently downloading data and it reveals a peculiar quirk about the way anti-virus software works. The real download is a copy of a Linux ISO we're downloading in Chrome. The download, however, was kicked over from Chrome to the Avast anti-virus scanner. If we didn't have Avast installed then the data would appear under the Chrome.exe directly.
If you're in a similar situation with an anti-virus application don't worry, there's a way to peek into the process list and get a good idea where the data is coming from if it is being filtered through an anti-virus scanner. You can sort the list by connections and see that Chrome (or whatever application is sending the data) ranks very close to the connection count of the anti-virus scanner. You can also click on the process that is doing the data filtering (in this case, the Avast scanner) and look at the connection data for the application. The mirror server at the University of Oregon narrows it down immediately to the large Linux distro we're downloading.

We highlighted a most-difficult-to-decipher scenario here, but most of the time reading the output from NetBalancer is dead simple. Barring any anti-virus scanner hijinks seeing which application is sucking down data is as easy as sorting the columns.
Going Beyond Merely Monitoring

NetBalancer is quite handy for peeking in at what applications are using your bandwidth but the original purpose of the application wasn't to merely watch. NetBalancer was designed to help you balance the load on your connection. You can allocate bandwidth based on process priority, increase and decrease bandwidth limits for individual applications, and otherwise ensure that your BitTorrent client or other bandwidth-hungry application won't wreck your Skype session.

The free version of NetBalancer only allows for up to 5 application restrictions. For most people this should be adequate (once you lock down your file sharing apps and give apps like Skype priority, you quickly run out of apps you need to tinker with). If you do need more to tweak more than five applications, you can grab a copy of the professional application for $25.
Have a burning question or technical problem? Email us at ask@howtogeek.com to get your question answered.