Navigating YouTube's analytics panel is a pain if you don't know what you're looking at, which is a shame since it's one of the most useful resources a content creator has at their disposal for measuring how well they're doing on the platform. Luckily, once you break it down, it's pretty simple.
What it All Means
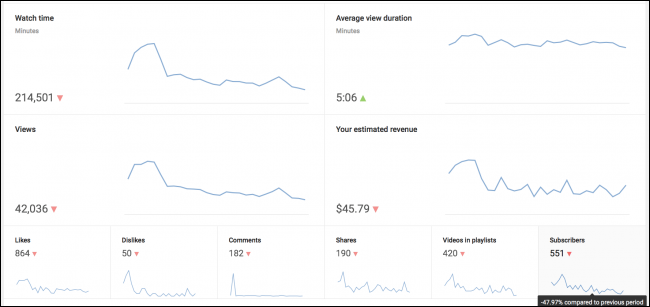
Open up the Analytics page and take a look at the main graphs in the center. YouTube's default timescale is 28 days (4 weeks). You can use the drop-down in the top right corner to change that scale to monthly, weekly, daily, or by all time.
The Analytics page is broken into a few sections:
- Watch Time: This section shows a total of how long people spent watching your videos during the selected period. This is measured in minutes, which makes the number seem a lot bigger. If this goes up, it likely just means more people are engaging with your content in general.
- Average View Duration: This section shows the average time people spend watching individual videos. If you see this number spike, it likely means a video you released engaged viewers more than normal. You can get a more detailed analysis by viewing that video's page separately.
- Views: This section is pretty straightforward, measuring how many people clicked on your videos during the selected period.
- Your Estimated Revenue: This section shows an estimate of your ad revenue for the period.
- Other Numbers: The rest of the options on the Analytics page are pretty self-explanatory and measure pretty much every interaction a viewer can have with your content.
All of these sections also show an up or down symbol that lets you know whether the statistic has improved or not from the previous period (like the previous month if you're viewing the default 28-day timescale). This is useful for tracking how your channel is doing over time.
More Detailed Statistics
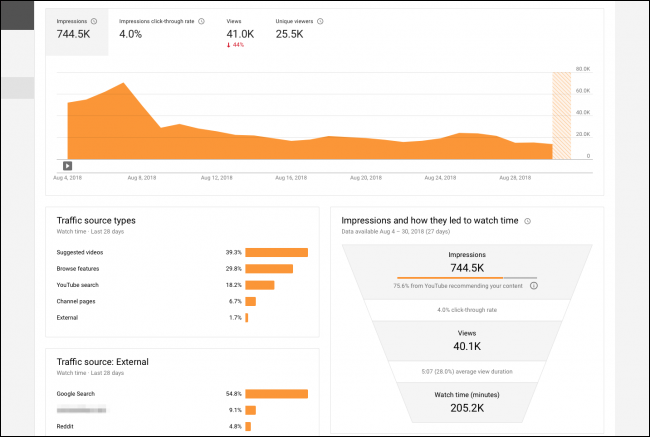
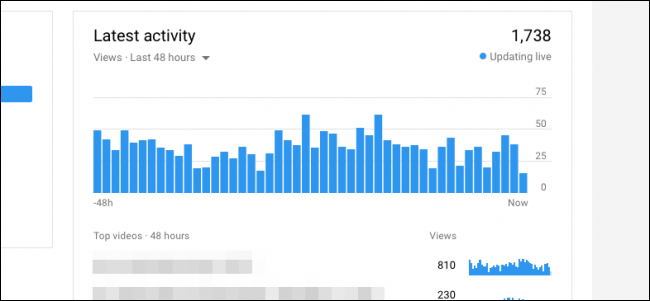
The default Analytics page is great, but YouTube's Beta Studio is even better. It's laid out better, and it also has some more interesting stats. Another nice thing about the beta studio is that it updates live. There's no need to wait around for normal analytics to come in, which can take a couple of days with the default Analytics page.
One important stat to track is impressions. This gives you an idea of how your video is faring with YouTube's algorithms. If you're getting more impressions, YouTube probably likes you more. These impressions lead to views from people clicking on your thumbnails (click-through rate) and to watch time, depending on how long they watch your video. Watch time is very important, as YouTube's algorithm heavily favors watch time. You can read more about the details of it here.
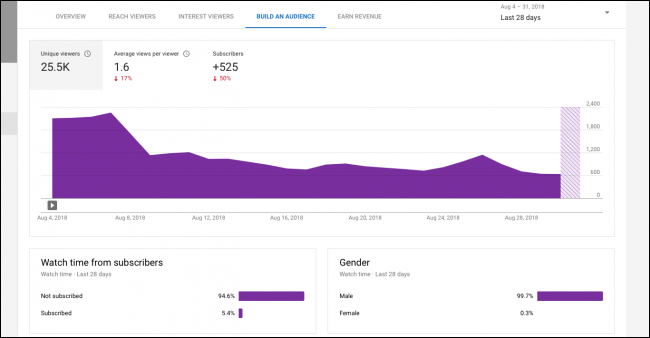
On the "Build an Audience" tab, you can see how many unique viewers you have per day, and also how much of that watch time is from subscribers. This can help you get a feel for how many people subscribe to your channel after watching one of your videos.
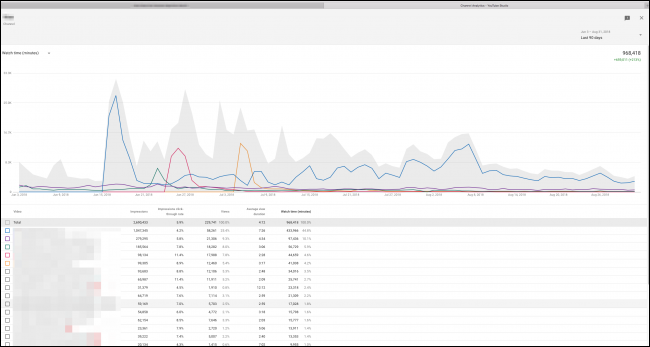
If you click on the "Top Videos" widget on the Overview tab, you're presented with this nice channel overview, which shows per-video performance over time, with detailed stats at the bottom.
Overall, YouTube's analytics are very thorough, even if a little hard to navigate, and I'd rather them have more statistics and data to ponder over than less.
Image Credit: Billion Photos/Shutterstock


