As a webmaster, I've often wanted to be able to see real-time hits as they arrive. Sure, Google Analytics is a wonderful package for looking at trends over time, but there's a delay of a few hours there, and you really can't see data like requests per second or total bytes. This is where the apachetop utility comes in. It's a very simple command line utility that you can use to monitor traffic real-time. It accomplishes this by parsing the apache logfiles and displaying meaningful output to the screen. Using Apachetop Once you've installed the utility (instructions below), you can launch it by simply running apachetop from the command line. Since apachetop sometimes defaults to the wrong directory for the logfiles, you can pass in the -f parameter to specify the location of the logfile. This is also helpful when you have many virtual hosts on the same box.
apachetop -f /var/www/vhosts/howtogeek.com/statistics/logs/access_log
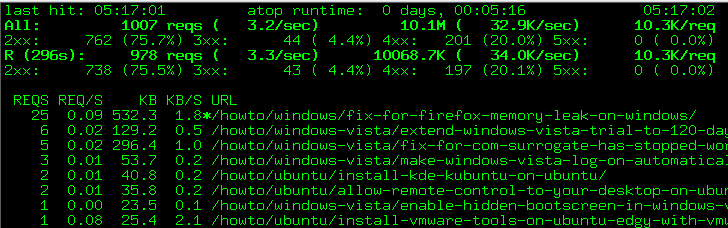
This is what you'll see after a few requests have come in: Monitoring Timeframe The first thing to note is that the default time range for data shown is 30 seconds, so don't expect the total counts to continue to climb forever. You can change this by passing in a few different arguments.
apachetop -H hits (Will display stats on the last x number of hits) apachetop -T secs (Will display stats on the last x number of seconds)
I've been using a range of 5-10 minutes in my testing, and it really shows some useful feedback. There's other options you can try out as well. Filters The next thing to note is that you can filter what gets shown in the view. To access the filters, use the f key, and you should see a small line pop up.

Hit the a key to add a filter and the line should switch. Now you can choose to filter by URL, referrer, or host.

I'm going to choose URL by hitting the u key. The filter dialog will show up near the bottom:

Since all of my articles are under the subdirectory /howto/, I'm going to enter that. Now apachetop will only show the hits relevant to hits to the articles, instead of every hit for every image. Viewing Request Details If you use the up/down keys, you'll notice the cursor move up and down to allow you to select a request. (notice the * char)

If you hit the Right arrow key, you'll be taken to the details page for that request. From here you can see the actual hosts hitting your site, as well as the referrers. I'm not going to show the hosts, since I don't want to give out user's IP address, but you can see the referrer here:

To go back to the list, just use the Left arrow key. Switch Between Hosts, Referrers and URLs If you use the d key, you can easily switch between the different views.

For instance, here I can see what traffic StumbleUpon is sending me, and then I can use the details view(right arrow) to see the exact articles that are getting hit from stumbleupon. Help At any point you can hit the ? or the h keys to take you to the help screen, which will give you a quick view of all the options.

I find the sort by very useful. Installing on Ubuntu
sudo apt-get install apachetop
Installing from Source on CentOS
wget http://www.webta.org/apachetop/apachetop-0.12.6.tar.gz yum install readline-devel yum install ncurses-devel tar xvzf apachetop-0.12.6.tar.gz cd apachetop-0.12.6 ./configure make
The binary can be found in src/apachetop, and you can copy it anywhere you'd like. Installing from Source on Ubuntu
wget http://www.webta.org/apachetop/apachetop-0.12.6.tar.gz sudo apt-get install ncurses-dev sudo apt-get install libreadline5-dev tar xvzf apachetop-0.12.6.tar.gz cd apachetop-0.12.6 ./configure make
The binary can be found in src/apachetop, and you can copy it anywhere you'd like.