Quick Links
Knowing your device's battery health can be crucial for gauging battery life and longevity. If you're a Chromebook user, you have a couple of useful tools for finding this info---especially if you want to track it over time.
Check Battery Stats with Crosh
If you're looking for a simple way to get more information about your battery, using the Chrome Shell---or CROSH---is the easiest way to do it. To open a Crosh window, just press Ctrl+Alt+T on your keyboard to open a terminal window.

At the terminal, type the following command and then press Enter:
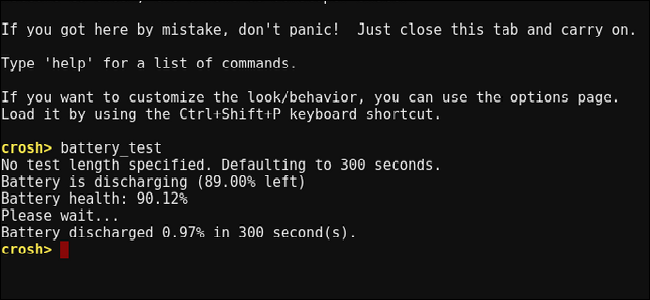
battery_test

This command shows you a few stats. First up, you'll see the current battery state (charging/discharging) along with the remaining percentage of battery life. You'll also see the battery's health, displayed as a percentage. The health represents the overall usable portion of the entire battery and shouldn't dramatically change over time.

The command also runs a simple discharge test, where it records the amount of battery drain over a specific amount of time. The default is 300 seconds, but you can change that time by appending a value in seconds to the end of the command, like so:
battery_test 30

In our example, the test runs for 30 seconds instead of 300. While you can do this for any value, it's probably not a good idea to go for extreme amounts of time here---stick to minutes, not hours. Just keep in mind that the value has to be entered in seconds when appended to the command.
Once the test has finished, it will tell you how much the battery drained in the specified amount of time, which can help you gauge how much battery life you'll get overall under a similar workload.
Find Advanced Battery Stats in Chrome OS' HIdden Power Menu
Like so many things in Chrome OS, many of the most powerful tools are hidden behind the scenes. That's the case with the Power Menu, which shows you battery charge and loss over time, as well as CPU states and idle times. To get there, open a new tab in your browser and type the following address into the Omnibox:
chrome://power
A barebones power menu shows you a few advanced options. To take a closer look at any of the options, click their corresponding "Show" button.

Clicking the "Show" button next to the Battery Charge entry reveals two displays: "Battery Charge Percentage" and "Battery Discharge Rate." The former simply shows the battery percentage drop (or gain if charging) over time, but in a much more granular way than you'll get in the status bar---it breaks the battery drain down by .1% at a time, so you can really see what's going on.

The "Battery Discharge Rate" display is a little harder to understand. It's a line graph that displays three different values. Without getting overly technical, here is a quick look at what each of these values represent:
- Discharge Rate in Watts: This shows the battery's discharge rate in terms of energy transfer, not just percentage.
- Moving Average: This essentially smooths out the battery discharge rate by using subsets of data and taking averages based on these larger sections of data.
- Binned Average: This combines clusters of data into a single, larger section of data, and then uses the average as the primary value.
You can also specify the number of samples in which to take the average by using the "Average Over" box at the very bottom. Type the number of samples you want to use and then click the "Reload" button. Playing with this will give you a better idea of what each value means, too.
Back on the main power menu, you'll also find the "Idle State Data" menu.
Idle state data doesn't directly show the battery output, but rather the processor cores and what each one is doing. It's a good way to see what's going on with the processor. But I'll be honest with you: there is a lot of data here, and probably more than you care to pay attention to. Still, it can be nice to see an overview of what each processor core is doing.

Finally, there's the "Frequency State Data" display, which I couldn't get to do anything during my testing. Turns out this could be a bug related to Intel chips. Maybe one day it will be fixed, but given that this bug has been in place since Chrome 41, I'm not holding my breath. I can't imagine it being very high on the priority list.

While there isn't a tool out there that will straight up tell you everything you could possibly want to know about your device's battery, these tools are a great start for learning the ins and outs of what goes on under the hood of your Chromebook.