The Performance Monitor is one of many useful tools buried deep in Windows. It can generate a System Diagnostics Report with information about problems and suggestions of how to fix them. If your computer isn't performing well or is experiencing another problem, this quick report might be able to help.
Other useful diagnostics tools include the Reliability Monitor, which provides more detailed information about crashes and other issues, and Windows Memory Diagnostics, which will check your computer's RAM for problems.
How to Generate a Report
To generate a report, press Windows Key + R to open a Run dialog box.
Type (or copy and paste) the following command into the box and press Enter:
perfmon /report

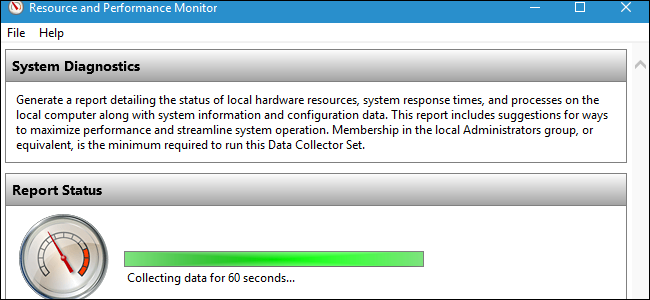
The Performance Monitor window will appear. Over the next 60 seconds, it'll monitor your PC's performance statistics so it can put together a report.

Reading the Report
After it completes, you'll see a very detailed report with a list of information and recommendations.
The top section offers a list of "warnings" with information about issues with your system and suggested fixes. On the Windows 7 system report below, we see a warning that the system isn't running an antivirus product registered with the Security Center.
Click the link to the right of "Related" to see more information about that problem on Microsoft's official documentation pages.
If you need more information about a problem, click the link to the right of "Symptom" to view more detailed technical information. Those technical details may be more helpful for performing a web search and finding information about your specific problem.

Further down, you'll see a number of "Basic System Checks." If everything went well, you'll see a green "Passed" result for all of them. These system checks check everything from your Windows version, SMART status to see if your hard drives are failing, and the status of various system services and hardware devices.
If any category of checks failed, expand that section for more information.

Below that, you'll see a "Resource Overview" in the Performance section. This will show you information about your system resource usage. If there's unusually high CPU, network, disk, or memory usage that could potentially be reducing the performance of your PC, this section will inform you of it.

At the bottom of the window, you'll just find several sections of technical information. You shouldn't need to dig through this information, as any problems here will be shown at the top of the report. Click the "Symptom" link for a problem and you'll be taken to the more detailed technical information about it near the bottom of the report.

Access System Diagnostic Reports Later
If you'd like to save a report for later--perhaps you want to show or send it to someone--you can click the "File" menu and select "Save As" to save it as an HTML file on your computer or "Print" to print it as a document.

You can also access reports later, even if you didn't save them at the time. To do so, open the Performance Monitor window. Press Windows Key + R, type the following command into the Run dialog, and press Enter:
perfmon

Navigate to Performance > Reports > System > System Diagnostics. You'll see an ordered list of every system diagnostics report you generated. The date and time the report was generated appear in each report, so you'll know when they were captured.

This tool won't help you solve every problem you experience, but it can provide some helpful information and give you some useful suggestions if your computer doesn't seem to be running well.