Quick Links
Have you ever needed to know what a remote device thinks the value of a metric is? HTG explains what the Simple Network Management Protocol (SNMP) is and how can you use it to monitor network devices.
Image by istargazer
Overview
The Simple Network Management protocol (SNMP) was created to give a common protocol foundation that network administrators can expect their device's manufacturers will use to expose different aspects of the product. Information such as CPU load, routing tables, and network traffic statistics, among many others, can all be accessed remotely with SNMP. One can also use SNMP to set configurations on devices that support it, but that is beyond the scope of this guide.
The read in/out from SNMP is done using a "Community" string. As the administrator, it is your job to set this string. Some examples on how to do this follow below.
Once connected to the device, you need to "pull" it for information using OIDs. Different OIDs give different pieces of information, and while in this guide we will be focusing on network traffic, you are encouraged to explore this world further. We will explain how to get the "mysterious" OIDs below.
Author's ramblings
I've started using this nifty way of viewing the router's info, way back in the first days of my DD-WRT studies. Nowadays, if i don't have it? I just feel blind. I simply cannot stress how valuable it is, when a user complains about the network speed, to be able to glance over what the border router says is the utilization and quickly resolve the issue.
Reading/graphing SNMP information (OIDs)
For instant gratification's sake, the how to read the SNMP information is placed first in the article, as most people won't need the configuration part over and over...
Alright, so you've configured the device for SNMP (if not, see some example how tos below), but how do you know what OIDs to read, and for that matter, how do you actually do it? There are numerous commercial and free programs to achieve this exact goal. We will focus on a couple of free ones you can use hassle free for graphing or browsing the entire OIDs name space.
"Bandwith Monitor" from Solarwinds (Graphing)
One can't really talk about "network monitoring" without running into Solarwinds, as its one of the major players in this field. We will not go into the plethora of networking products Solarwinds offers, but rather focus on a free utility called "FREE Real-Time Bandwidth Monitor".
This utility has two drawbacks:
- It is aimed to show network bandwidth, so is not suited for retrieving other SNMP information.
- It doesn't give an option to save/open configuration files.
If the above limitations are an issue, read on to one of the other options.
Download and install using the regular "Next" -> "Next" -> "Finish" procedure and open the program.
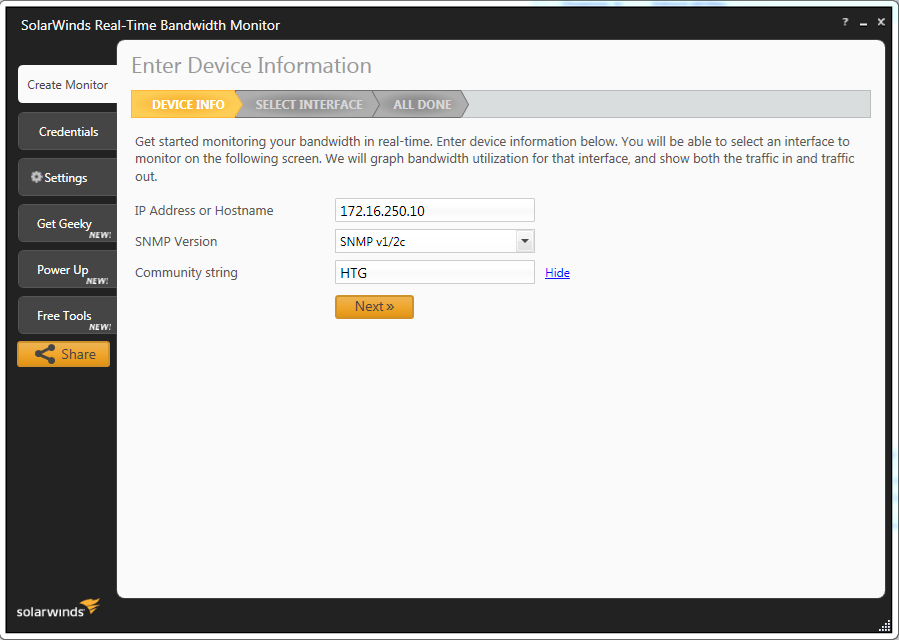
You should be presented with a wizard as shown below. Fill in the target device's "IP" and "community" information and click "Next".
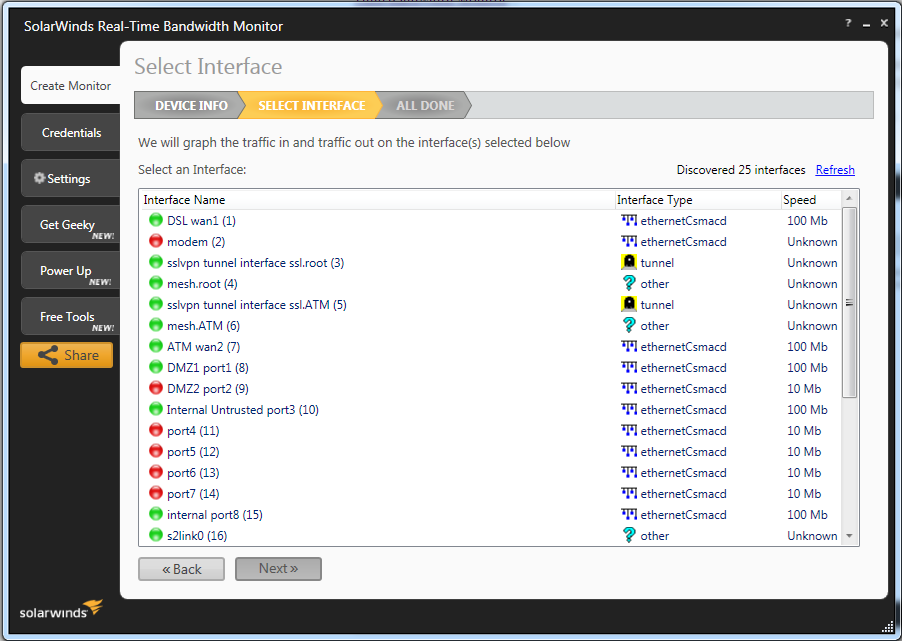
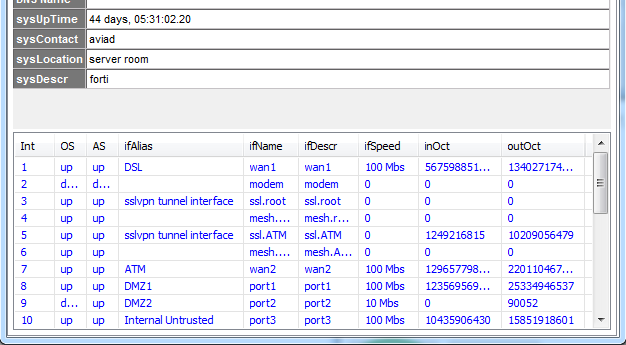
The program will "pull" the device for it's interfaces and show them in a friendly formatted, colorized, and name enumerated list.
Choose the interfaces you wish to monitor (multiple selection is possible with CTRL) and click "Next".
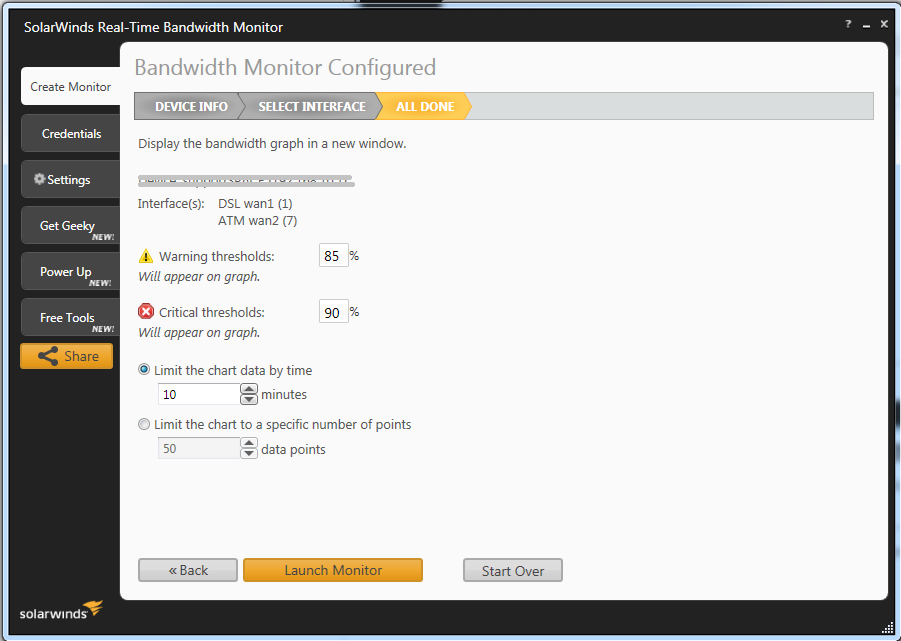
In the example above, we've selected two interfaces called "DSL wan1" & "ATM wan2". You can accept the default settings and click "Launch Monitor".
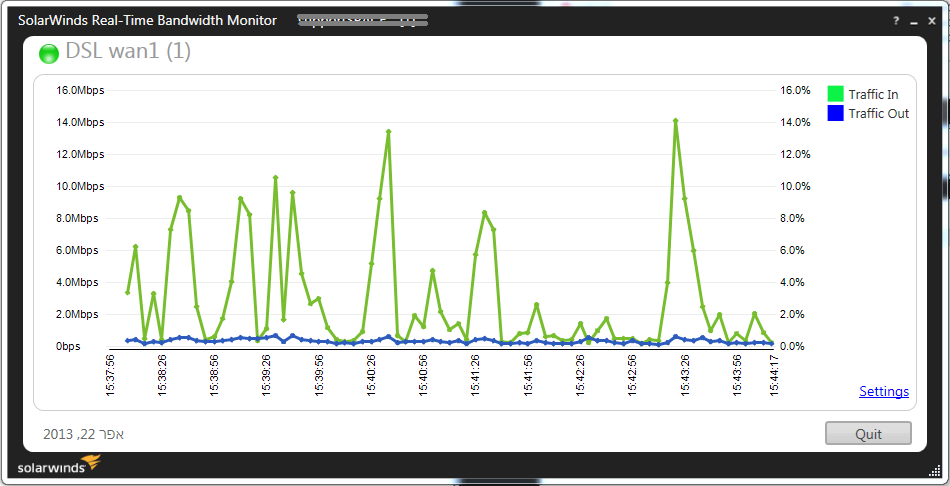
Graph windows as the above one, should open up and start to show traffic information with a 5 second (configurable) refresh interval.
Note about the refresh interval: The real advantage of this program is that, of all the programs I've come across, this was the only one that tells you if your refresh interval is too short. During the past week, I've had the distinct "pleasure" of debugging a problem with SNMP readouts, as it seems some devices can't (or simply won't) update their statistics more then X times/sec (7 for Juniper devices). This program was the only one that told me that my refresh interval was too quick, which explained why I was getting wonky results.
Unless you still need to enable SNMP on the target device (see below), you are DONE.
Rejoice and be on your merry way :)
"Flowalyzer" from Plixer (Graphing)
This free utility, called Flowalyzer, is very simple to operate. It looks like Plixer took the well known STG utility (explained below) and wrapped it into something a bit more user friendly. It also features the "translate from OIDs to names list" functionality. The advantage of this utility in comparison to the Solarwinds one is that it is possible to extract the OIDs in their numeric form.
With that said, it has two severe drawbacks:
- I've found that the program is not suited for prolonged monitoring periods, as it will inexplicably & randomly crash.
- While it has the advantage of being able to save its configuration into files and then invoke them by associating the program to the suffix, it is also extremely touchy about where the files are saved. I have found that if the directory tree holding the saved files contains "spaces", when trying to invoke them, the program will error out.
In summation, use this program to obtain the OIDs and "feed them to the STG program" and/or "get the Hell out of Dodge".
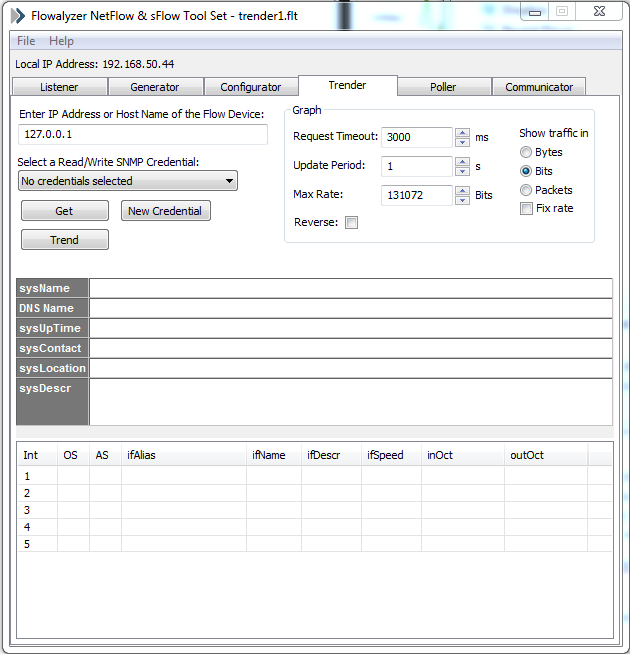
When you open the program, you'll be greeted with the below window.
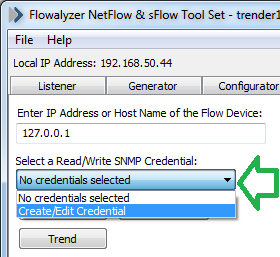
Click on the "Select a R/W SNMP Credential" dropdown list and click on "Create/Edit".
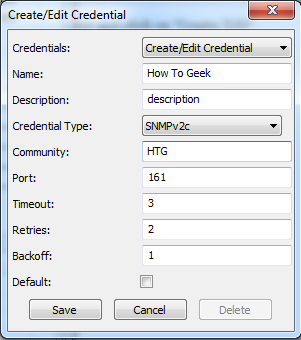
Fill in the information required for your target devices (mainly the community string) and save.
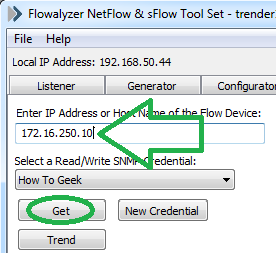
Fill the IP of the target device and click on "Get".
Once you do that, the bottom half of the program window should populate with information pulled from the device like the below picture.
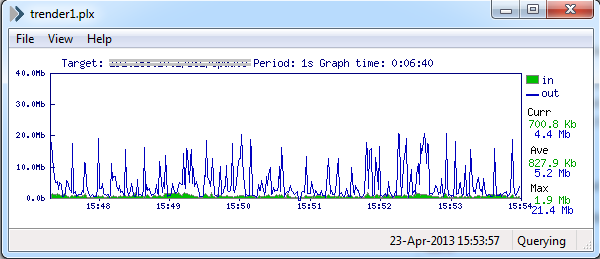
Clicking on one of the lines should pop-up a monitor window like the one below.
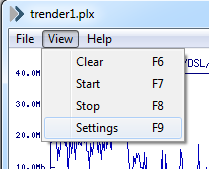
To obtain the long sought after OID, click on "View" -> "Settings".
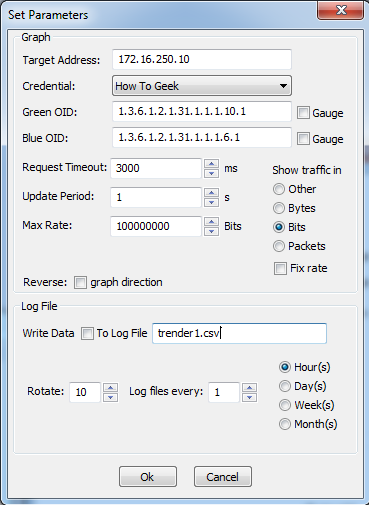
In the next window, one can see the OIDs for the incoming/outgoing traffic.
You got the OIDs, yay!!
Simple Traffic Monitor (STG) from Leonid Mikhailov (Graphing)
This free utility is by far the oldest of the options, but it works flawlessly for literally years and can keep its configuration in shareable files. The only drawback is that you need to obtain the OIDs by other means.
Download the program either from us (to avoid hotlinking) or the author.
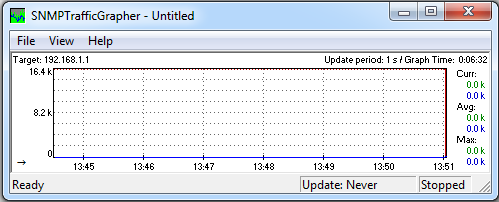
Extract the zip file to a location of your choosing and run it. You will be presented with a blank window.
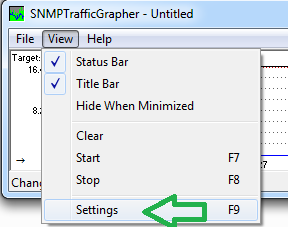
Click on "View" -> "Settings".
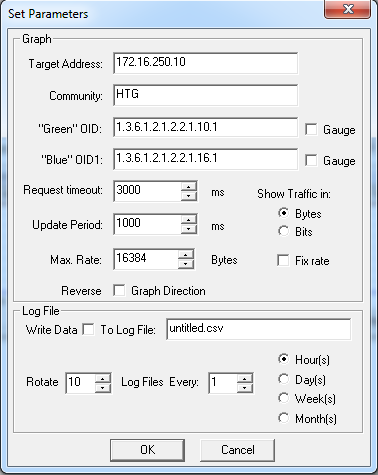
In the next window, you need to input the OIDs as you got them from some other method (at least two in this guide).
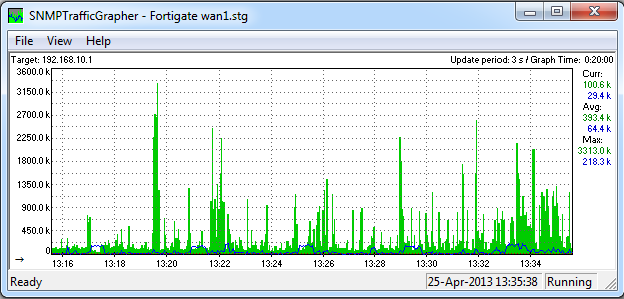
If all went well, the main window should fill with information and look like the below.
GetIF by SNMP4tPC (Browsing the OIDs tree)
This program is old, and while newer options are available, due to the fact that it is free, it gets the job done, and is the one that got me started, honor demands I pay homage to it.
Using this program or one like it will enable you to extract more information than "just" the device's interface information. With that said, we will be using the interface's example just to make the follow through more readable.
Download the program either from us (to avoid hotlinking) or the author.
Install using the regular "Next" -> "Next" -> "Finish" procedure and open the program.
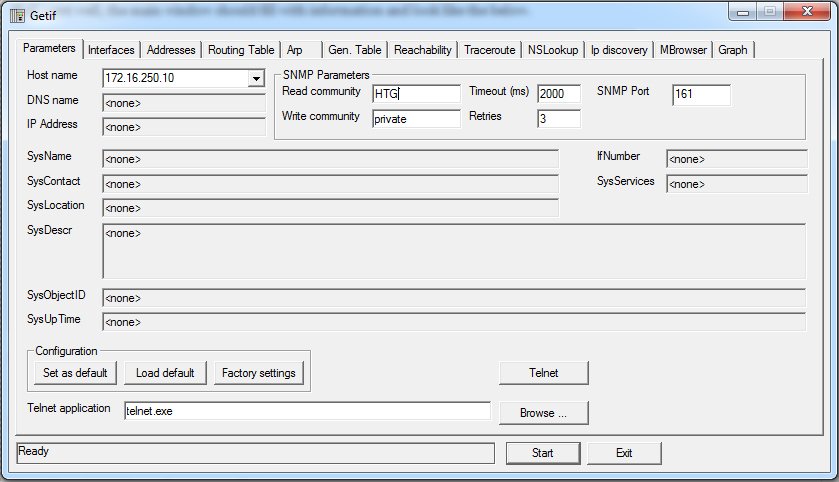
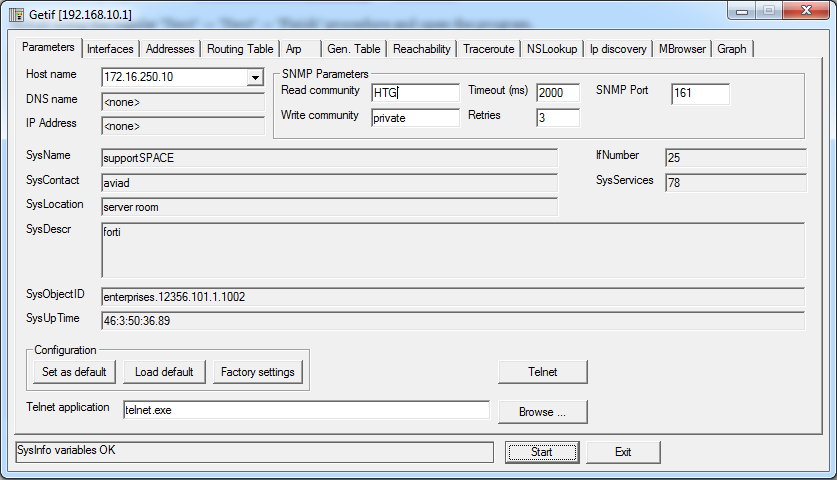
Fill in the information for the target device and click "Start".
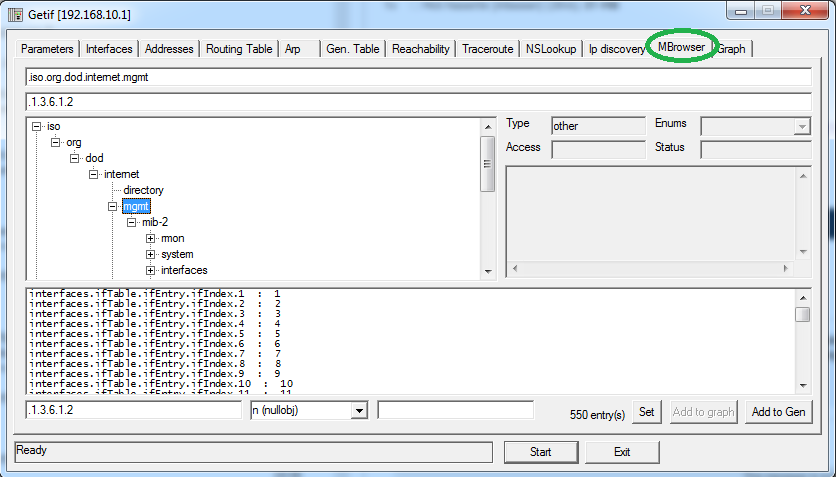
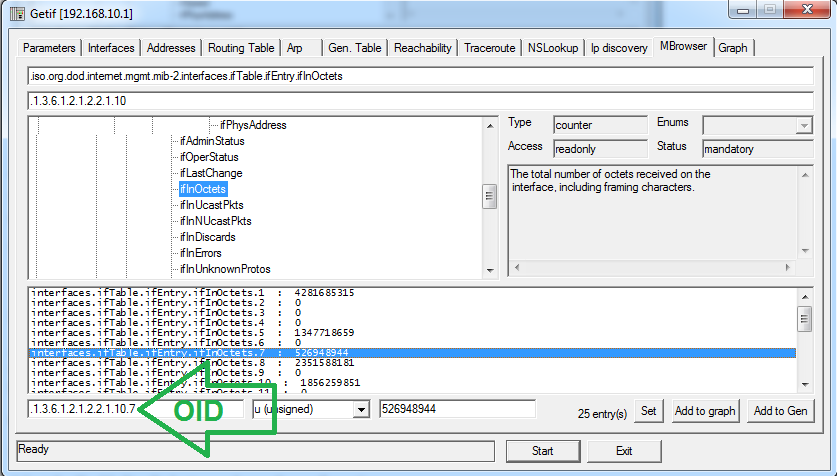
To walk the OIDs tree, go to the "MBrowser" tab.
Once you see a segment that you want to read, select it and click on "Start".
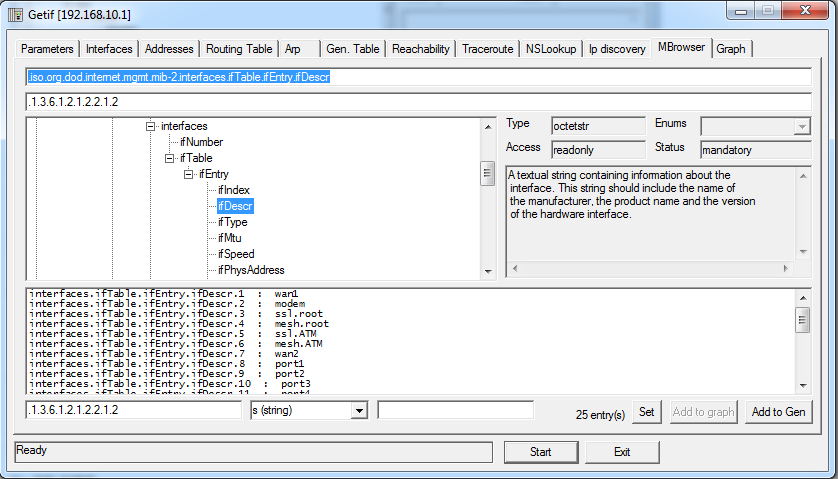
For example, to obtain the same "interface" information we got using the programs above, browse to: iso -> org -> dod -> internet -> mgmt -> mib-2 -> interfaces -> ifTable -> ifEntry ->ifDescr and click "Start"
The bottom half of the window now shows the "Names" given to the interfaces on the target device. To get the "traffic OIDs", note the number of the interface (in our example, wan2=interface7) and continue to the "ifInOctets" & "ifOutOctets" subtrees.
They are located at: iso -> org ->dod ->internet ->mgmt.mib-2 -> interfaces -> ifTable -> ifEntry -> ifInOctets.
Click on the Interface you want to monitor traffic for and note the OID from the bottom left part of the window.
You are now ready to take the OIDs you've collected to one of the monitoring programs above.
Enabling SNMP on the target device
Almost every self respecting device that can be networked supports exposing its information in this way. With that said, not every device does, and you may need to consult your device's documentation to find out how to do this. Below are some examples I have in my close vicinity, but this is by no means an exhaustive list.
On DD-WRT
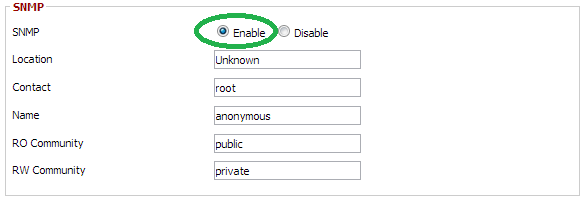
In the WebGUI, go to "Services" and scroll down the page to find the "SNMP" radio button.
Select the "Enabled" radio button and save the configuration.
Once enabled, you will be presented with the details that you may change. It is important that you note what "RO community" you are using. The default is "public", but you may change this to any other value that you wish. Save and apply the changes.
On Fortigate (FortiOS)
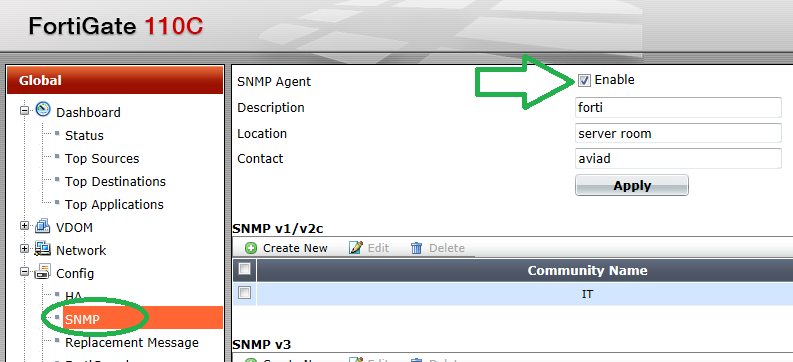
Assuming a fairly recent version of FortiOS (v4 and above), in the main window expand the "Config" pane and select "SNMP".
Note: The above screenshot has been taken from a v5 FortiOS.
To create a new "SNMP v1/v2c" community, click on "Create New".
Fill in the information such as "community name", the range of IPs that are allowed to access it, and from what "interface". Once done, Click "OK" at the bottom of the page to save your settings.
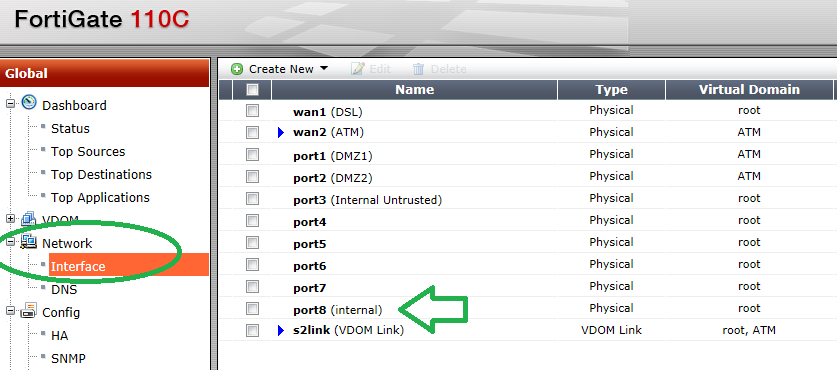
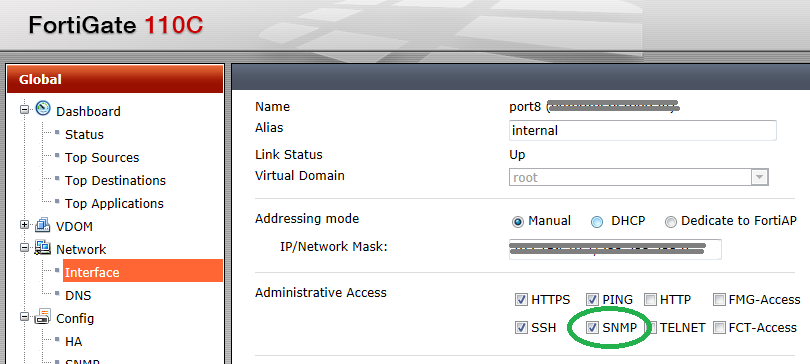
You also need to enable the interface you want to read the information from, for SNMP traffic. To do this, go to "Config" -> "Network".
In this example we used "port8", so we will edit that interface.
Check the "SNMP" checkbox and click "OK" at the bottom of the page.
Note: The interface you are trying to read SNMP from must be in the "management Vdom" if VDOMs are enabled on your device. Changing the management Vdom is out of the scope of this guide.
On Juniper (JunOS)
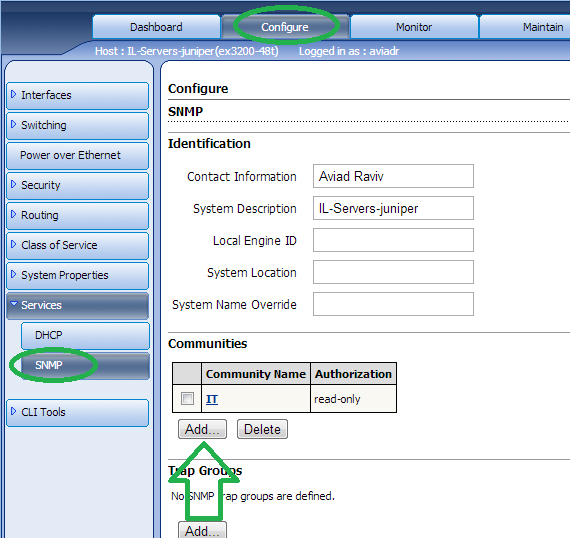
In the WebGUI, go to "Configure" -> "Services" -> "SNMP".
Click on "Add".
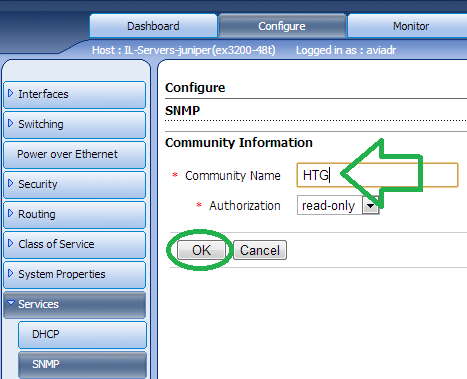
Fill in the "Community name" of your choice and select the "Authorization" type.
Save and Commit your changes for them to take affect.
On NetAPP
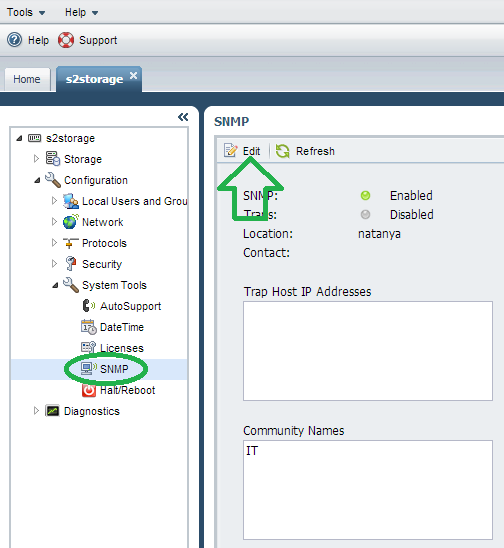
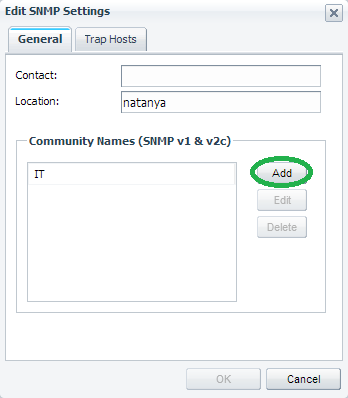
Open the "NetApp OnCommand System Manager" and log into your storage device. Under "Configuration" -> "System Tools", click on "SNMP" and then "Edit".
Click "Add".
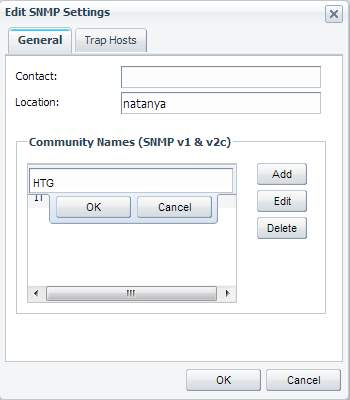
This will enable you to add a new "Community" string as shown below.
Fill in the desired name and click "OK" all the way back.
On Windows
It is possible to activate SNMP on windows, it is just rarely used or even talked about (looking right at you, MS certifications...). You will need to install the service first.
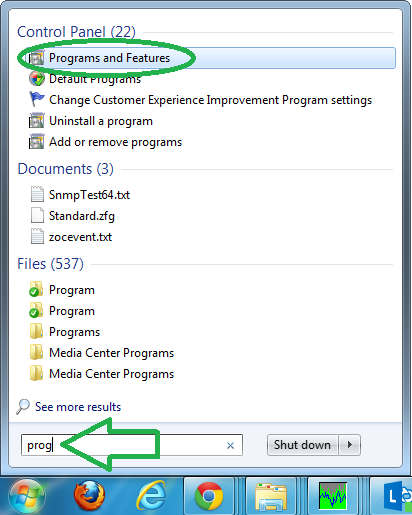
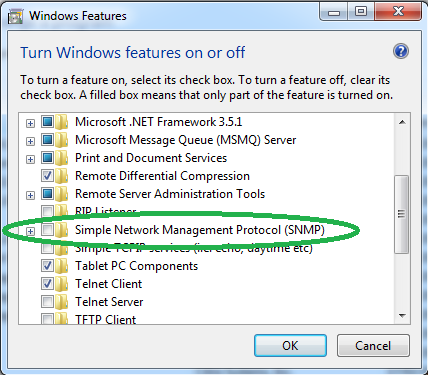
Install the service by going to "Programs and Features".
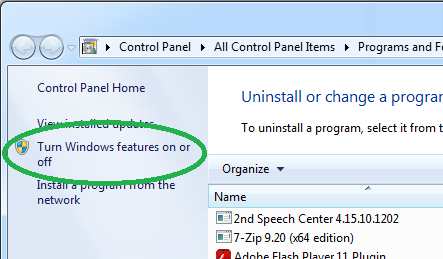
Go into "Turning Windows features on or off".
Scroll to find the "Simple Network Management Protocol (SNMP)". Check its checkbox and click "OK" for it to be installed.
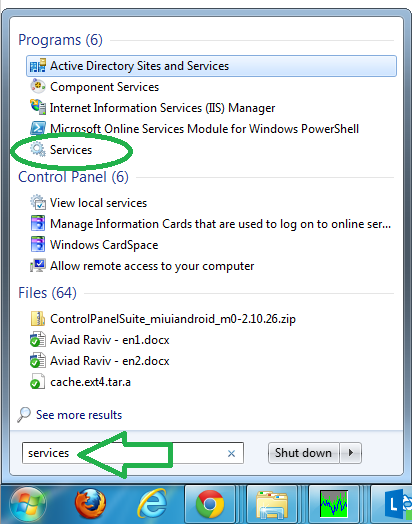
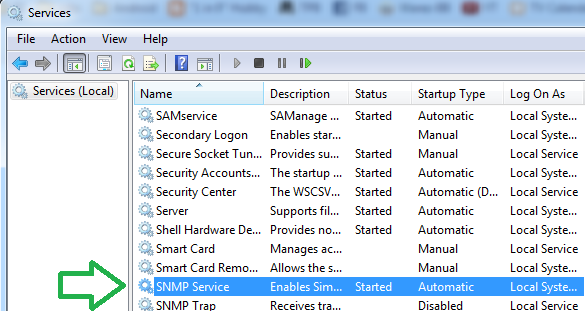
Once installed, configure the community string by opening "Services".
Scroll to find the service and go into its properties.
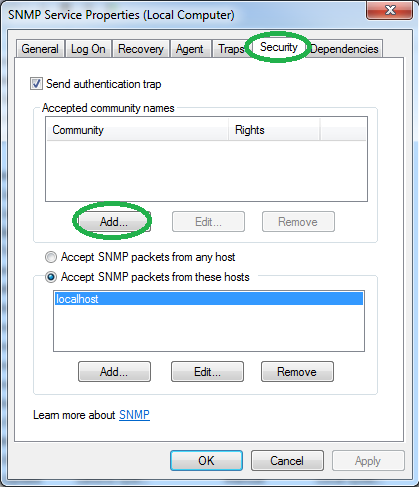
Go to the "Security" tab.
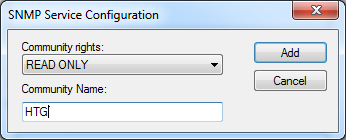
To add a community, click on "Add".
Fill in the desired community name and click "Add" and OK for the settings to take affect.
Note: You may need to change other properties to enable remote machines to get the readout, but that is beyond the scope of this guide.
That's it, you should be all set to graph your network's information, and you are encouraged to explore what the SNMP protocol can offer you beyond the scope of this guide, such as: using MIBs and traps. Just remember the summarizing quote from below...
We are all the sum of our tears. Too little and the ground is not fertile, and nothing can grow there. Too much, the best of us is washed away. (Babylon 5 g'kar)


