Quick Links
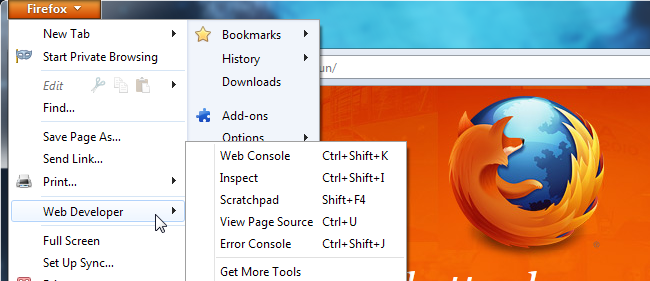
Firefox's Web Developer menu contains tools for inspecting pages, executing arbitrary JavaScript code, and viewing HTTP requests and other messages. Firefox 10 added an all-new Inspector tool and updated Scratchpad.
Firefox's new web developer features, in combination with awesome web-developer add-ons like Firebug and the Web Developer Toolbar, make Firefox an ideal browser for web developers. All tools are available under Web Developer in Firefox's menu.
Page Inspector
Inspect a specific element by right-clicking it and selecting Inspect (or pressing Q). You can also launch the Inspector from the Web Developer menu.

You'll see a toolbar at the bottom of the screen, which you can use to control the inspector. Your selected element will be highlighted and other elements on the page will be dimmed.

If you want to choose a new element, click the Inspect button on the toolbar, hover your mouse over the page and click your element. Firefox highlights the element under your cursor.

You can navigate between parent and child elements by clicking the breadcrumbs on the toolbar.
HTML Inspector
Click the HTML button to view the HTML code of the currently selected element.

The HTML inspector allows you to expand and collapse the HTML tags, making it easy to visualize at a glance. If you want to see the page's HTML in a flat file, you can select View Page Source from the Web Developer menu.

CSS Inspector
Click the Style button to see the CSS rules applied to the selected element.

There's also a CSS properties panel -- switch between the two by clicking the Rules and Properties buttons. To help you find specific properties, the properties panel includes a search box.

You can edit the element's CSS on the fly from the Rules panel. Uncheck any of the check boxes to deactivate a rule, click the text to change a rule, or add your own rules to the element at the top of the pane. Here, I've added the font-weight: bold; CSS rule, making the element's text bold.

JavaScript Scratchpad
The Scratchpad also saw an update with Firefox 10, and now contains syntax highlighting. You can type in JavaScript code to run on the current page.

Once you have, click the Execute menu and select Run. The code runs in the current tab.

Web Console
The Web Console replaces the old Error Console, which has been deprecated and will be removed in a future version of Firefox.

The console displays four different types of messages, which you can toggle the visibility of -- network requests, CSS error messages, JavaScript error messages and web developer messages.
What's a web developer message? It's a message printed to the window.console object. For example, we could run the window.console.log("Hello World"); JavaScript code in the Scratchpad to print a developer message to the console. Web developers can integrate these messages into their JavaScript code to help with debugging.

Refresh the page and you'll see the generated network requests and other messages.

Use the search box to filter the messages; click a request if you want to see more details.

As of Firefox 10, the Web Console can work in tandem with the Page Inspector. The $0 variable represents the currently selected object in the inspector. So, for example, if you wanted to hide the currently selected object, you could run $0.style.display="none" in the console.

If you're interested in learning more about using the console and its built-in functions, check out the Web Console page on Mozilla's Developer Network website.
Get More Tools
The Get More Tools option takes you to the Web Developer's Toolbox add-on collection on the Mozilla Add-Ons website. It contains some of the best add-ons for web developers, including Firebug and the Web Developer Toolbar.
If you've been using Firefox for a few years, you may remember the DOM Inspector. Firefox's integrated developer tools have come a long way since then.